APPENDIX STUDENT'St CRITICAL VALUES This table shows the f-value that defines the area for the stated degrees of freedom (d.f.) Confidence Level Confidence Level 80 .90 95 .98 .99 80 .90 .95 .98 .99 Significance Level for Two-Tailed Test Significance Level for Two-Tailed Test .20 .20 10 05 02 01 10 .02 .01 05 Significance Level for One-Tailed Test Significance Level for One-Tailed Test .005 d.f. 10 05 025 01 d.f. .10 05 025 .01 .005 6.314 1 3.078 12.706 31.821 63.657 36 1.306 1.688 2.028 2.434 2.719 2.920 2.715 2 1.886 4.303 6.965 9.925 37 1.305 1.687 2.026 2.431 1.638 4.541 1.686 2.024 2.353 3.182 5.841 38 1.304 2.429 2.712 2.132 2.776 3.747 2.708 4 1.533 4.604 39 1.304 1.685 2.023 2.426 2.015 2.571 2.021 2.423 2.704 5 1.476 3.365 4.032 40 1.303 1.684 6 1.440 1.943 2.447 3.143 3.707 41 1.303 1.683 2.020 2.421 2.701 2.018 2.418 7 1.415 1.895 2.365 2.998 3.499 42 1.302 1.682 2.698 1.860 2.306 2.695 1.397 2.896 3.355 43 1.302 1.681 2.017 2.416 2.821 3.250 2.015 2.414 9 1.383 1.833 2.262 44 1.301 1.680 2.692 3.169 1.301 2.412 2.690 10 1.372 1.812 2.228 2.764 45 1.679 2.014 2.718 3.106 11 1.363 1.796 2.201 46 1.300 1.679 2.013 2.410 2.687 12 1.356 1.782 2.179 2.681 3.055 47 1.300 1.678 2.012 2.408 2.685 2.407 2.682 13 1.350 1.771 2.160 2.650 3.012 48 1.299 1.677 2.011 2.977 2.010 2.405 2.680 14 1.345 1.761 2.145 2.624 49 1.299 1.677 1.341 2.403 15 1.753 2.131 2.602 2.947 50 1.299 1.676 2.009 2.678 2.668 55 1.297 1.673 2.396 16 1.337 1.746 2.120 2.583 2.921 2.004 17 1.333 1.740 2.110 2.567 2.898 60 1.296 1.671 2.000 2.390 2.660 18 1.330 1.734 2.101 2.552 2.878 65 1.295 1.669 1.997 2.385 2.654 1.328 1.729 19 2.093 2.539 2.861 70 1.294 1.667 1.994 2.381 2.648 2.643 20 1.325 1.725 2.086 2.528 2.845 75 1.293 1.665 1.992 2.377 21 1.323 80 1.292 1.721 2.080 2.518 2.831 1.664 1.990 2.374 2.639 2.819 1.292 2.635 22 1.321 1.717 2.074 2.508 85 1.663 1.988 2.371 1.319 23 1.714 2.069 2.500 2.807 90 1.291 1.662 1.987 2.368 2.632 1.291 1.661 24 1.318 1.711 2.064 2.492 2.797 95 1.985 2.366 2.629 2.626 25 1.316 1.708 2.060 2.485 2.787 100 1.290 1.660 1.984 2.364 1.706 26 1.315 2.056 2.479 2.779 110 1.289 1.659 1.982 2.361 2.621 1.703 2.473 1.658 2.358 27 1.314 2.052 2.771 120 1.289 1.980 2.617 2.614 28 1.313 1.701 2.048 2.467 2.763 130 1.288 1.657 1.978 2.355 2.045 29 1.311 1.699 2.462 2.756 140 1.288 1.656 1.977 2.353 2.611 2.042 1.287 30 1.310 1.697 2.457 2.750 150 1.655 1.976 2.351 2.609 1.696 31 1.309 2.040 2.453 2.744 1.282 1.645 1.960 2.326 2.576 32 1.309 1.694 2.037 2.449 2.738 1.308 2.035 33 1.692 2.445 2.733 2.032 2.441 2.728 34 1.307 1.691 1.306 1.690 35 2.030 2.438 2.724 Note: As n increases, critical values of Student's t approach the z-values in the last line of this table. A common rule of thumb is to usez when n 30, but that is not conservative. 8

Glencoe Algebra 1, Student Edition, 9780079039897, 0079039898, 2018
18th Edition
ISBN:9780079039897
Author:Carter
Publisher:Carter
Chapter10: Statistics
Section: Chapter Questions
Problem 25SGR
icon
Related questions
Question

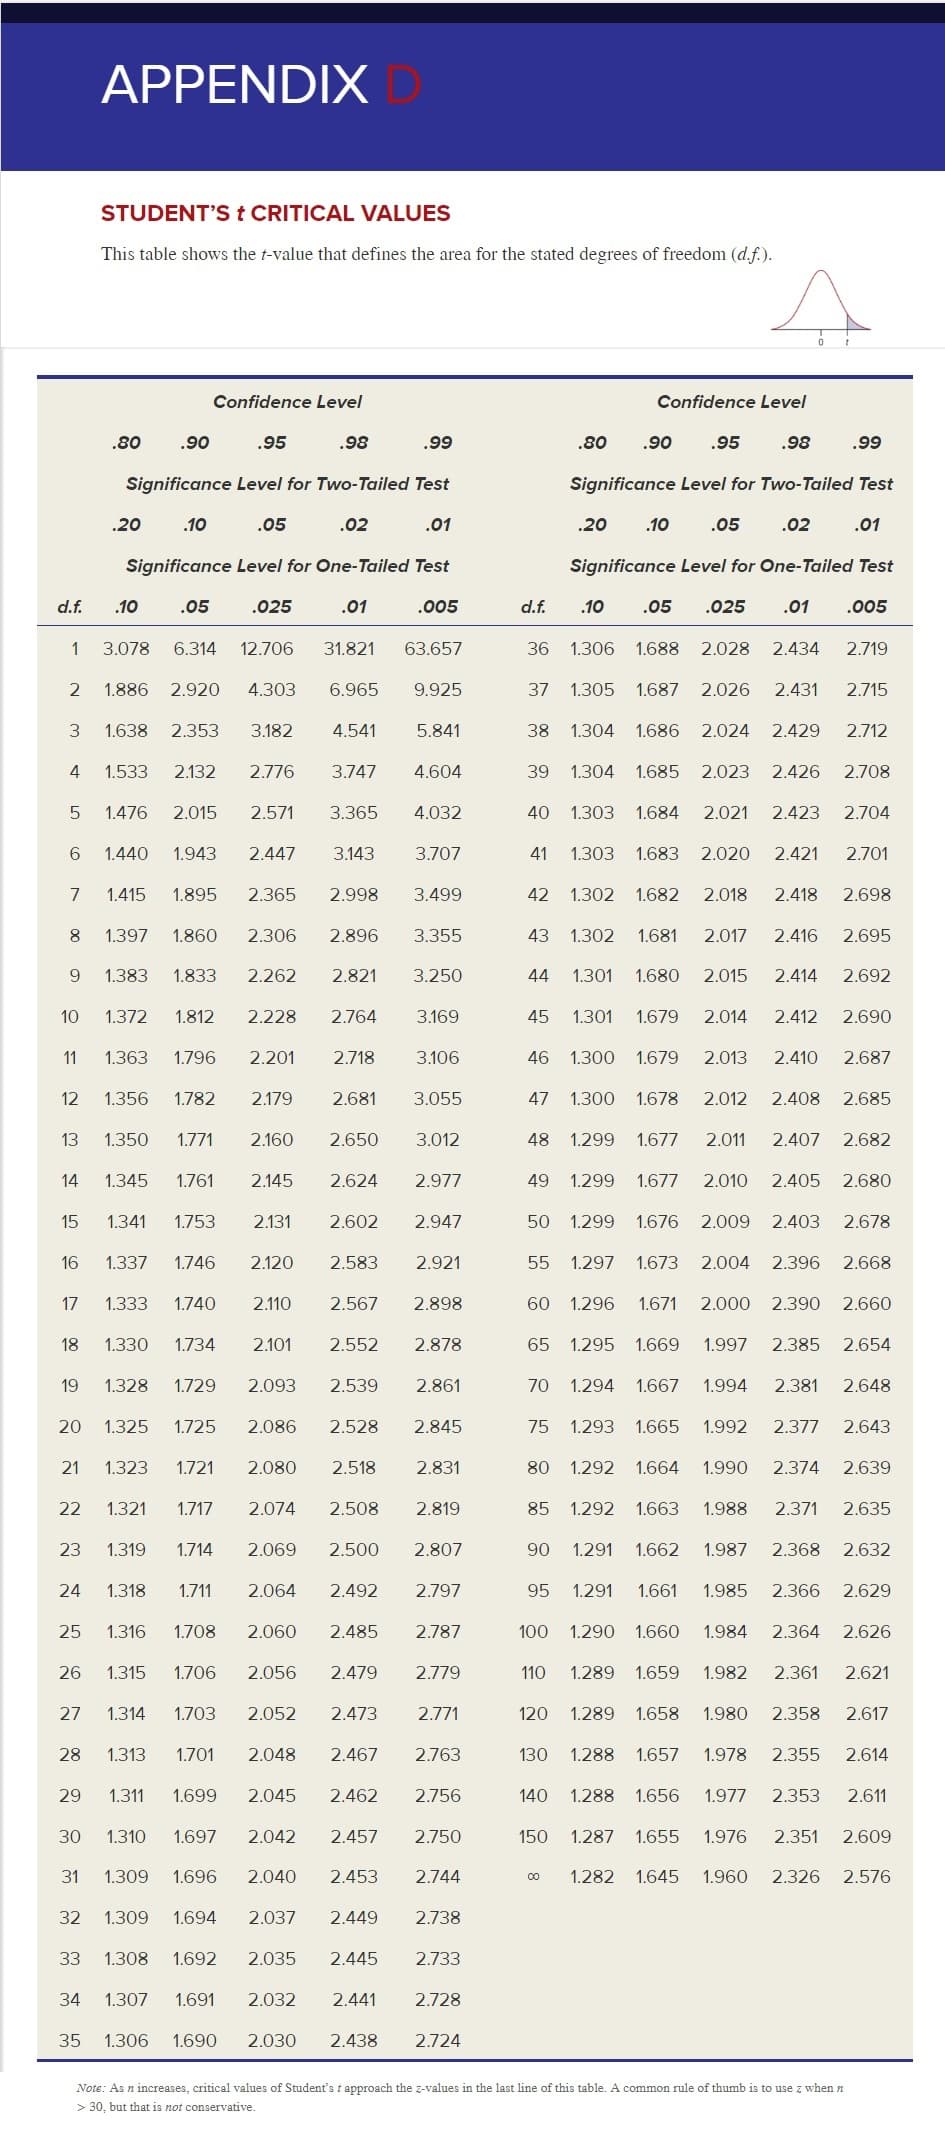
A random sample of 11 items is drawn from a population whose standard deviation is unknown. The sample mean is x⎯⎯x¯ = 810 and the sample standard deviation is s = 20. Use Appendix D to find the values of Student’s t.
 
(a) Construct an interval estimate of μ with 98% confidence. (Round your answers to 3 decimal places.)
  
The 98% confidence interval is from ______ to ________ 
 
(b) Construct an interval estimate of μ with 98% confidence, assuming that s = 40. (Round your answers to 3 decimal places.)
  
The 98% confidence interval is from _______ to ________ 
 
(c) Construct an interval estimate of μ with 98% confidence, assuming that s = 80. (Round your answers to 3 decimal places.)
  
The 98% confidence interval is from ______ to ________ 
 
(d) Describe how the confidence interval changes as s increases.
  

  • The interval stays the same as s increases.
  • The interval gets wider as s increases.
  • The interval gets narrower as s increases.
APPENDIX
STUDENT'St CRITICAL VALUES
This table shows the f-value that defines the area for the stated degrees of freedom (d.f.)
Confidence Level
Confidence Level
80
.90
95
.98
.99
80
.90
.95
.98
.99
Significance Level for Two-Tailed Test
.20
.20
10
05
02
01
10
.02
.01
05
Significance Level for One-Tailed Test
.005
d.f.
10
05
025
01
d.f.
.10
05
025
.01
.005
6.314
1
3.078
12.706
31.821
63.657
36 1.306
1.688
2.028
2.434
2.719
2.920
2.715
2
1.886
4.303
6.965
9.925
37
1.305 1.687 2.026
2.431
1.638
4.541
1.686 2.024
2.353
3.182
5.841
38
1.304
2.429
2.712
2.132
2.776
3.747
2.708
4
1.533
4.604
39
1.304
1.685 2.023
2.426
2.015
2.571
2.021
2.423
2.704
5
1.476
3.365
4.032
40
1.303
1.684
6
1.440
1.943
2.447
3.143
3.707
41
1.303
1.683
2.020
2.421
2.701
2.018
2.418
7
1.415
1.895
2.365
2.998
3.499
42 1.302
1.682
2.698
1.860
2.306
2.695
1.397
2.896
3.355
43
1.302 1.681
2.017
2.416
2.821
3.250
2.015
2.414
9
1.383
1.833
2.262
44
1.301
1.680
2.692
3.169
1.301
2.412
2.690
10
1.372
1.812
2.228
2.764
45
1.679
2.014
2.718
3.106
11
1.363
1.796
2.201
46 1.300
1.679
2.013
2.410
2.687
12
1.356
1.782
2.179
2.681
3.055
47
1.300 1.678
2.012
2.408
2.685
2.407 2.682
13
1.350
1.771
2.160
2.650
3.012
48
1.299
1.677
2.011
2.977
2.010
2.405 2.680
14
1.345
1.761
2.145
2.624
49 1.299 1.677
1.341
2.403
15
1.753
2.131
2.602
2.947
50 1.299 1.676
2.009
2.678
2.668
55 1.297 1.673
2.396
16
1.337
1.746
2.120
2.583
2.921
2.004
17
1.333
1.740
2.110
2.567
2.898
60 1.296
1.671 2.000
2.390 2.660
18
1.330
1.734
2.101
2.552
2.878
65 1.295
1.669
1.997
2.385
2.654
1.328
1.729
19
2.093
2.539
2.861
70 1.294
1.667
1.994
2.381
2.648
2.643
20
1.325
1.725
2.086
2.528
2.845
75 1.293
1.665
1.992
2.377
21 1.323
80 1.292
1.721
2.080
2.518
2.831
1.664
1.990
2.374
2.639
2.819
1.292
2.635
22
1.321
1.717
2.074
2.508
85
1.663
1.988
2.371
1.319
23
1.714
2.069
2.500
2.807
90
1.291 1.662
1.987
2.368
2.632
1.291
1.661
24
1.318
1.711
2.064
2.492
2.797
95
1.985
2.366
2.629
2.626
25
1.316
1.708
2.060
2.485
2.787
100
1.290
1.660
1.984
2.364
1.706
26
1.315
2.056
2.479
2.779
110
1.289 1.659
1.982
2.361
2.621
1.703
2.473
1.658
2.358
27
1.314
2.052
2.771
120
1.289
1.980
2.617
2.614
28
1.313
1.701
2.048
2.467
2.763
130
1.288
1.657
1.978
2.355
2.045
29
1.311
1.699
2.462
2.756
140
1.288 1.656
1.977
2.353
2.611
2.042
1.287
30
1.310
1.697
2.457
2.750
150
1.655
1.976
2.351
2.609
1.696
31
1.309
2.040
2.453
2.744
1.282
1.645
1.960
2.326 2.576
32
1.309
1.694
2.037
2.449
2.738
1.308
2.035
33
1.692
2.445
2.733
2.032
2.441
2.728
34
1.307
1.691
1.306
1.690
35
2.030
2.438
2.724
Note: As n increases, critical values of Student's t approach the z-values in the last line of this table. A common rule of thumb is to usez when n
30, but that is not conservative.
8
Transcribed Image Text:APPENDIX STUDENT'St CRITICAL VALUES This table shows the f-value that defines the area for the stated degrees of freedom (d.f.) Confidence Level Confidence Level 80 .90 95 .98 .99 80 .90 .95 .98 .99 Significance Level for Two-Tailed Test Significance Level for Two-Tailed Test .20 .20 10 05 02 01 10 .02 .01 05 Significance Level for One-Tailed Test Significance Level for One-Tailed Test .005 d.f. 10 05 025 01 d.f. .10 05 025 .01 .005 6.314 1 3.078 12.706 31.821 63.657 36 1.306 1.688 2.028 2.434 2.719 2.920 2.715 2 1.886 4.303 6.965 9.925 37 1.305 1.687 2.026 2.431 1.638 4.541 1.686 2.024 2.353 3.182 5.841 38 1.304 2.429 2.712 2.132 2.776 3.747 2.708 4 1.533 4.604 39 1.304 1.685 2.023 2.426 2.015 2.571 2.021 2.423 2.704 5 1.476 3.365 4.032 40 1.303 1.684 6 1.440 1.943 2.447 3.143 3.707 41 1.303 1.683 2.020 2.421 2.701 2.018 2.418 7 1.415 1.895 2.365 2.998 3.499 42 1.302 1.682 2.698 1.860 2.306 2.695 1.397 2.896 3.355 43 1.302 1.681 2.017 2.416 2.821 3.250 2.015 2.414 9 1.383 1.833 2.262 44 1.301 1.680 2.692 3.169 1.301 2.412 2.690 10 1.372 1.812 2.228 2.764 45 1.679 2.014 2.718 3.106 11 1.363 1.796 2.201 46 1.300 1.679 2.013 2.410 2.687 12 1.356 1.782 2.179 2.681 3.055 47 1.300 1.678 2.012 2.408 2.685 2.407 2.682 13 1.350 1.771 2.160 2.650 3.012 48 1.299 1.677 2.011 2.977 2.010 2.405 2.680 14 1.345 1.761 2.145 2.624 49 1.299 1.677 1.341 2.403 15 1.753 2.131 2.602 2.947 50 1.299 1.676 2.009 2.678 2.668 55 1.297 1.673 2.396 16 1.337 1.746 2.120 2.583 2.921 2.004 17 1.333 1.740 2.110 2.567 2.898 60 1.296 1.671 2.000 2.390 2.660 18 1.330 1.734 2.101 2.552 2.878 65 1.295 1.669 1.997 2.385 2.654 1.328 1.729 19 2.093 2.539 2.861 70 1.294 1.667 1.994 2.381 2.648 2.643 20 1.325 1.725 2.086 2.528 2.845 75 1.293 1.665 1.992 2.377 21 1.323 80 1.292 1.721 2.080 2.518 2.831 1.664 1.990 2.374 2.639 2.819 1.292 2.635 22 1.321 1.717 2.074 2.508 85 1.663 1.988 2.371 1.319 23 1.714 2.069 2.500 2.807 90 1.291 1.662 1.987 2.368 2.632 1.291 1.661 24 1.318 1.711 2.064 2.492 2.797 95 1.985 2.366 2.629 2.626 25 1.316 1.708 2.060 2.485 2.787 100 1.290 1.660 1.984 2.364 1.706 26 1.315 2.056 2.479 2.779 110 1.289 1.659 1.982 2.361 2.621 1.703 2.473 1.658 2.358 27 1.314 2.052 2.771 120 1.289 1.980 2.617 2.614 28 1.313 1.701 2.048 2.467 2.763 130 1.288 1.657 1.978 2.355 2.045 29 1.311 1.699 2.462 2.756 140 1.288 1.656 1.977 2.353 2.611 2.042 1.287 30 1.310 1.697 2.457 2.750 150 1.655 1.976 2.351 2.609 1.696 31 1.309 2.040 2.453 2.744 1.282 1.645 1.960 2.326 2.576 32 1.309 1.694 2.037 2.449 2.738 1.308 2.035 33 1.692 2.445 2.733 2.032 2.441 2.728 34 1.307 1.691 1.306 1.690 35 2.030 2.438 2.724 Note: As n increases, critical values of Student's t approach the z-values in the last line of this table. A common rule of thumb is to usez when n 30, but that is not conservative. 8
Expert Solution
trending now

Trending now

This is a popular solution!

steps

Step by step

Solved in 5 steps with 4 images

Blurred answer
Knowledge Booster
Point Estimation, Limit Theorems, Approximations, and Bounds
Learn more about
Need a deep-dive on the concept behind this application? Look no further. Learn more about this topic, statistics and related others by exploring similar questions and additional content below.
Similar questions
Recommended textbooks for you
Glencoe Algebra 1, Student Edition, 9780079039897…
Algebra
ISBN:
9780079039897
Author:
Carter
Publisher:
McGraw Hill