Arandom sample of 25 12th-grade students was selected. The sample mean height was 167.5 centimeters, and the sample standard deviation was 11.3 centimeters. a. A technology input menu for calculating a confidence interval requires a sample size, a sample mean, and a sample standard deviation. State how you would fill in these numbers b. Using the accompanying technology output, report the confidence interval in a carefully worded sentence. A Click the icon to view the technology output. a. Sample size: Sample mean: Standard deviation: Technology Output (Type integers or decimals. Do not round.) b. Choose the correct interpretation of the confidence interval below and fill in the answer boxes to complete your choice Mean 25 167 5 One-Sample T SE Mean 2 260 V that the N v is between and StDev 11.300 95% CI (162.836, 172.164) (Round to the nearest integer as needed. Use ascending order) Print Done
Arandom sample of 25 12th-grade students was selected. The sample mean height was 167.5 centimeters, and the sample standard deviation was 11.3 centimeters. a. A technology input menu for calculating a confidence interval requires a sample size, a sample mean, and a sample standard deviation. State how you would fill in these numbers b. Using the accompanying technology output, report the confidence interval in a carefully worded sentence. A Click the icon to view the technology output. a. Sample size: Sample mean: Standard deviation: Technology Output (Type integers or decimals. Do not round.) b. Choose the correct interpretation of the confidence interval below and fill in the answer boxes to complete your choice Mean 25 167 5 One-Sample T SE Mean 2 260 V that the N v is between and StDev 11.300 95% CI (162.836, 172.164) (Round to the nearest integer as needed. Use ascending order) Print Done

Glencoe Algebra 1, Student Edition, 9780079039897, 0079039898, 2018
18th Edition
ISBN:9780079039897
Author:Carter
Publisher:Carter
Chapter10: Statistics
Section10.5: Comparing Sets Of Data
Problem 1GP

Related questions

Question
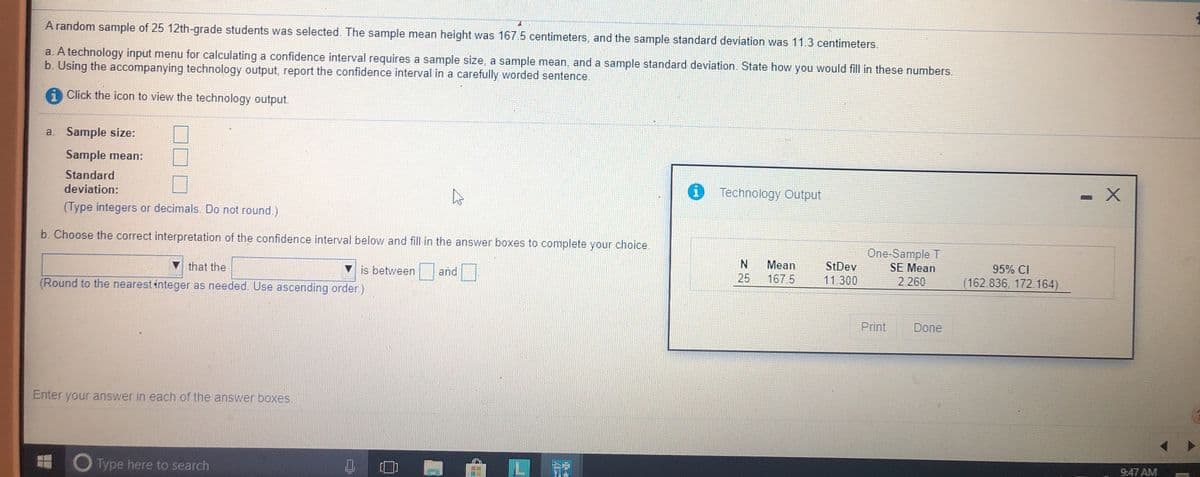
Transcribed Image Text:A random sample of 25 12th-grade students was selected. The sample mean height was 167.5 centimeters, and the sample standard deviation was 11.3 centimeters.
a. A technology input menu for calculating a confidence interval requires a sample size, a sample mean, and a sample standard deviation. State how you would fill in these numbers.
b. Using the accompanying technology output, report the confidence interval in a carefully worded sentence.
Click the icon to view the technology output.
a. Sample size:
Sample mean:
Standard
deviation:
0 Technology Output
(Type integers or decimals. Do not round.)
b. Choose the correct interpretation of the confidence interval below and fill in the answer boxes to complete your choice.
Mean
167 5
One-Sample T
SE Mean
that the
is between
and
StDev
95% CI
(Round to the nearest integer as needed. Use ascending order)
25
11.300
(162.836, 172.164)
2.260
Print
Done
Enter your answer in each of the answer boxes.
O Type here to search
9:47 AM
我
Expert Solution
This question has been solved!
Explore an expertly crafted, step-by-step solution for a thorough understanding of key concepts.

This is a popular solution!

Trending now
This is a popular solution!

Step by step
Solved in 2 steps with 2 images

Knowledge Booster


Learn more about
Need a deep-dive on the concept behind this application? Look no further. Learn more about this topic, statistics and related others by exploring similar questions and additional content below.Recommended textbooks for you
Glencoe Algebra 1, Student Edition, 9780079039897…
Algebra
ISBN:
9780079039897
Author:
Carter
Publisher:
McGraw Hill
Glencoe Algebra 1, Student Edition, 9780079039897…
Algebra
ISBN:
9780079039897
Author:
Carter
Publisher:
McGraw Hill