Are America's top chief executive officers (CEOS) really worth all that money? One way to answer this question is to look at row B, the annual company percentage increase in revenue, versus row A, the CEO's annual percentage salary increase in that same company. Suppose that a random sample of companies yielded the following data: B: Percent increase 12 14 16 24 15 10 10 9 for company A: Percent increase 2 10 15 20 10 14 3 0 for CEO
Are America's top chief executive officers (CEOS) really worth all that money? One way to answer this question is to look at row B, the annual company percentage increase in revenue, versus row A, the CEO's annual percentage salary increase in that same company. Suppose that a random sample of companies yielded the following data: B: Percent increase 12 14 16 24 15 10 10 9 for company A: Percent increase 2 10 15 20 10 14 3 0 for CEO

Glencoe Algebra 1, Student Edition, 9780079039897, 0079039898, 2018
18th Edition
ISBN:9780079039897
Author:Carter
Publisher:Carter
Chapter4: Equations Of Linear Functions
Section: Chapter Questions
Problem 8SGR

Related questions
Question
No Excel
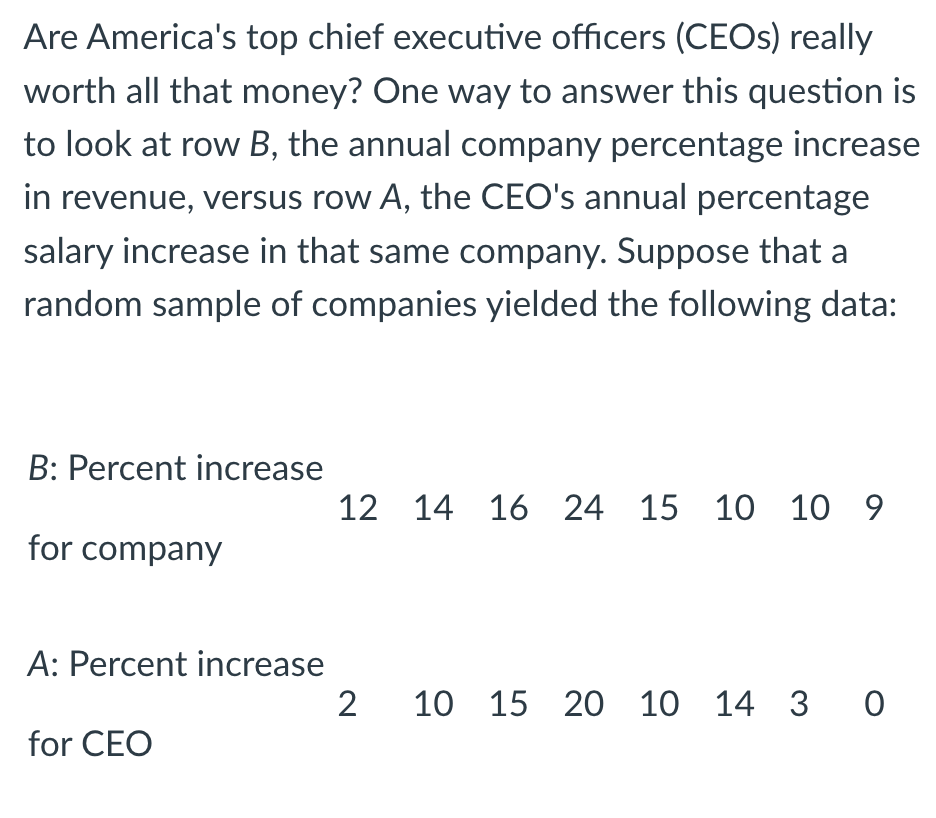
Transcribed Image Text:Are America's top chief executive officers (CEOS) really
worth all that money? One way to answer this question is
to look at row B, the annual company percentage increase
in revenue, versus row A, the CEO's annual percentage
salary increase in that same company. Suppose that a
random sample of companies yielded the following data:
B: Percent increase
12
14 16 24 15 10 10 9
for company
A: Percent increase
10 15 20 10 14 3 0
for CEO
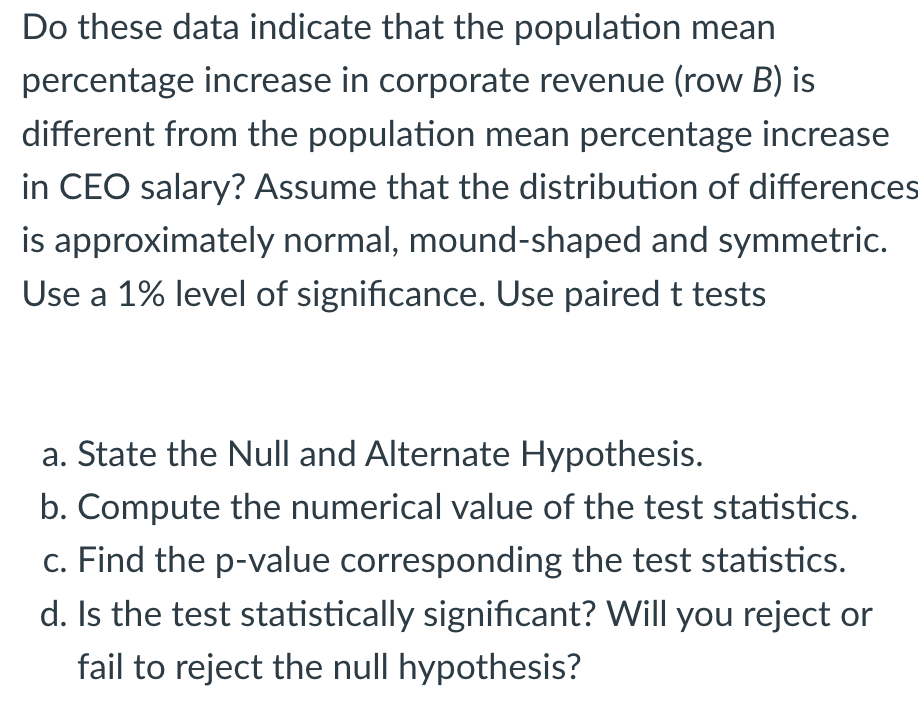
Transcribed Image Text:Do these data indicate that the population mean
percentage increase in corporate revenue (row B) is
different from the population mean percentage increase
in CEO salary? Assume that the distribution of differences
is approximately normal, mound-shaped and symmetric.
Use a 1% level of significance. Use paired t tests
a. State the Null and Alternate Hypothesis.
b. Compute the numerical value of the test statistics.
c. Find the p-value corresponding the test statistics.
d. Is the test statistically significant? Will you reject or
fail to reject the null hypothesis?
Expert Solution
This question has been solved!
Explore an expertly crafted, step-by-step solution for a thorough understanding of key concepts.

Step by step
Solved in 5 steps

Knowledge Booster


Learn more about
Need a deep-dive on the concept behind this application? Look no further. Learn more about this topic, statistics and related others by exploring similar questions and additional content below.Recommended textbooks for you
Glencoe Algebra 1, Student Edition, 9780079039897…
Algebra
ISBN:
9780079039897
Author:
Carter
Publisher:
McGraw Hill
Glencoe Algebra 1, Student Edition, 9780079039897…
Algebra
ISBN:
9780079039897
Author:
Carter
Publisher:
McGraw Hill