Areas under the Normal Curve The column under A gives the proportion of the area under the entire curve that is betweenz=0 and a positive value of z. Because the curve is symmetric about 0, the area between z=0 and a negative value of z can I found by using the corresponding positive value of z. 0.00 0.01 0.02 0.03 0.04 0.05 0.06 0.07 0.08 0.09 0.10 0.11 0.12 0.13 0.14 0.15 0.16 0.17 0.18 0.19 0.20 0.21 0.22 0.23 0.24 0.25 0.26 0.27 0.28 0.29 0.000 0.004 0.008 0.012 0.016 0.020 0.024 0.028 0.032 0.036 0.040 0.044 0.048 0.052 0.056 0.060 0.064 0.067 0.071 0.075 0.079 0.083 0.087 0.091 0.095 0.099 0.103 0.106 0.110 0.114 0.30 0.31 0.32 0.33 0.34 0.35 0.36 0.37 0.38 0.39 0.40 0.41 0.42 0.43 0.44 0.45 0.46 0.47 0.48 0.49 0.50 0.51 0.52 0.53 0.54 0.55 0.56 0.57 0.58 0.59 0.118 0.122 0.126 0.129 0.133 0.137 0.141 0.144 0.148 0.152 0.155 0.159 0.163 0.166 0.170 0.174 0.177 0.181 0.184 0.188 0.191 0.195 0.198 0.202 0.205 0.209 0.212 0.216 0.219 0.222 0.60 0.61 0.62 0.63 0.64 0.65 0.66 0.67 0.68 0.69 0.70 0.71 0.72 0.73 0.74 0.75 0.76 0.77 0.78 0.79 0.80 0.81 0.82 0.83 0.84 0.85 0.86 0.87 0.88 0.89 0.226 0.229 0.232 0.236 0.239 0.242 0.245 0.249 0.252 0.255 0.258 0.261 0.264 0.267 0.270 0.273 0.276 0.279 0.282 0.285 0.288 0.291 0.294 0.297 0.300 0.302 0.305 0.308 0.311 0.313 0.90 0.91 0.92 0.93 0.94 0.95 0.96 0.97 0.98 0.99 1.00 1.01 1.02 1.03 1.04 1.05 1.06 1.07 1.08 1.09 1.10 1.11 1.12 1.13 1.14 1.15 1.16 1.17 1.18 1.19 0.316 0.319 0.321 0.324 0.326 0.329 0.331 0.334 0.336 0.339 0.341 0.344 0.346 0.348 0.351 0.353 0.355 0.358 0.360 0.362 0.364 0.367 0.369 0.371 0.373 0.375 0.377 0.379 0.381 0.383 1.20 1.21 1.22 1.23 1.24 1.25 1.26 1.27 1.28 1.29 1.30 1.31 1.32 1.33 1.34 1.35 1.36 1.37 1.38 1.39 1.40 1.41 1.42 1.43 1.44 1.45 1.46 1.47 1.48 1.49 0.385 0.387 0.389 0.391 0.393 0.394 0.396 0.398 0.400 0.401 0.403 0.405 0.407 0.408 0.410 0.411 0.413 0.415 0.416 0.418 0.419 0.421 0.422 0.424 0.425 0.426 0.428 0.429 0.431 0.432 1.50 1.51 1.52 1.53 1.54 1.55 1.56 1.57 1.58 1.59 1.60 1.61 1.62 1.63 1.64 1.65 1.66 1.67 1.68 1.69 1.70 1.71 1.72 1.73 1.74 1.75 1.76 1.77 1.78 1.79 0.433 0.434 0.436 0.437 0.438 0.439 0.441 0.442 0.443 0.444 0.445 0.446 0.447 0.448 0.449 0.451 0.452 0.453 0.454 0.454 0.455 0.456 0.457 0.458 0.459 0.460 0.461 0.462 0.462 0.463 Areas under the Normal Curve The column under A gives the proportion of the area under the entire curve that is between z=0 and a positive value of z. Because the curve is symmetric about 0, the area betweenz=0 and a negative value of z can be found by using the corresponding positive value of z. こ 0.499 0.499 0.499 0.499 0.499 0.499 0.499 0.499 0.499 0.499 0.499 0.499 0.499 0.499 0.499 0.499 0.499 0.499 0.499 0.499 0.499 0.499 0.499 0.499 0.499 0.499 0.499 0.499 0.499 0.499 3.30 3.31 3.32 3.33 3.34 3.35 3.36 3.37 3.38 3.39 3.40 3.41 3.42 3.43 3.44 3.45 3.46 3.47 3.48 3.49 3.50 3.51 3.52 3.53 3.54 3.55 3.56 3.57 3.58 3.59 0.500 0.500 0.500 0.500 0.500 0.500 0.500 0.500 0.500 0.500 0.500 0.500 0.500 0.500 0.500 0.500 0.500 0.500 0.500 0.500 0.500 0.500 0.500 0.500 0.500 0.500 0.500 0.500 0.500 0.500 0.482 2.40 0.483 2.41 0.483 2.42 0.483 2.43 0.484 2.44 0.484 2.45 0.485 2.46 2.47 0.485 0.485 2.48 2.49 0.486 0.486 2.50 0.492 0.492 0.492 0.492 0.493 0.493 0.493 0.493 0.493 0.494 0.494 0.494 0.494 0.494 0.494 0.495 0.495 0.495 0.495 0.495 0.495 0.495 0.496 0.496 0.496 0.496 0.496 0.496 0.496 0.496 2.70 2.71 2.72 2.73 2.74 2.75 2.76 2.77 2.78 2.79 2.80 2.81 2.82 2.83 2.84 2.85 2.86 2.87 2.88 2.89 2.90 2.91 2.92 2.93 2.94 2.95 2.96 2.97 2.98 2.99 0.497 3.00 1.80 1.81 1.82 1.83 1.84 1.85 1.86 1.87 1.88 1.89 1.90 1.91 1.92 1.93 1.94 1.95 1.96 1.97 1.98 1.99 2.00 2.01 2.02 2.03 2.04 2.05 2.06 2.07 2.08 2.09 0.464 0.465 0.466 0.466 0.467 0.468 0.469 0.469 0.470 0.471 0.471 0.472 0.473 0.473 0.474 0.474 0.475 0.476 0.476 0.477 0.477 0.478 0.478 0.479 0.479 0.480 0.480 0.481 0.481 0.482 2.10 2.11 2.12 2.13 2.14 2.15 2.16 2.17 2.18 2.19 2.20 2.21 2.22 2.23 2.24 2.25 2.26 2.27 2.28 2.29 2.30 2.31 2.32 2.33 2.34 2.35 2.36 2.37 2.38 2.39 0.497 3.01 0.497 3.02 0.497 3.03 0.497 3.04 0.497 3.05 0.497 3.06 0.497 3.07 0.497 3.08 0.497 3.09 0.497 3.10 3.11 0.498 3.12 0.498 0.498 3.13 0.498 3.14 3.15 0.498 0.498 3.16 0.498 3.17 3.18 0.498 0.498 3.19 0.498 3.20 0.498 3.21 0.498 3.22 0.498 3.23 0.498 3.24 0.498 3.25 0.498 3.26 0.499 3.27 0.499 3.28 0.499 3.29 0.486 2.51 0.487 2.52 0.487 2.53 0.487 0.488 2.54 2.55 0.488 2.56 0.488 0.489 0.489 0.489 2.57 2.58 2.59 2.60 0.490 2.61 0.490 0.490 0.490 0.491 0.491 2.62 2.63 2.64 2.65 2.66 0.491 2.67 0.491 0.492 2.68 2.69
Areas under the Normal Curve The column under A gives the proportion of the area under the entire curve that is betweenz=0 and a positive value of z. Because the curve is symmetric about 0, the area between z=0 and a negative value of z can I found by using the corresponding positive value of z. 0.00 0.01 0.02 0.03 0.04 0.05 0.06 0.07 0.08 0.09 0.10 0.11 0.12 0.13 0.14 0.15 0.16 0.17 0.18 0.19 0.20 0.21 0.22 0.23 0.24 0.25 0.26 0.27 0.28 0.29 0.000 0.004 0.008 0.012 0.016 0.020 0.024 0.028 0.032 0.036 0.040 0.044 0.048 0.052 0.056 0.060 0.064 0.067 0.071 0.075 0.079 0.083 0.087 0.091 0.095 0.099 0.103 0.106 0.110 0.114 0.30 0.31 0.32 0.33 0.34 0.35 0.36 0.37 0.38 0.39 0.40 0.41 0.42 0.43 0.44 0.45 0.46 0.47 0.48 0.49 0.50 0.51 0.52 0.53 0.54 0.55 0.56 0.57 0.58 0.59 0.118 0.122 0.126 0.129 0.133 0.137 0.141 0.144 0.148 0.152 0.155 0.159 0.163 0.166 0.170 0.174 0.177 0.181 0.184 0.188 0.191 0.195 0.198 0.202 0.205 0.209 0.212 0.216 0.219 0.222 0.60 0.61 0.62 0.63 0.64 0.65 0.66 0.67 0.68 0.69 0.70 0.71 0.72 0.73 0.74 0.75 0.76 0.77 0.78 0.79 0.80 0.81 0.82 0.83 0.84 0.85 0.86 0.87 0.88 0.89 0.226 0.229 0.232 0.236 0.239 0.242 0.245 0.249 0.252 0.255 0.258 0.261 0.264 0.267 0.270 0.273 0.276 0.279 0.282 0.285 0.288 0.291 0.294 0.297 0.300 0.302 0.305 0.308 0.311 0.313 0.90 0.91 0.92 0.93 0.94 0.95 0.96 0.97 0.98 0.99 1.00 1.01 1.02 1.03 1.04 1.05 1.06 1.07 1.08 1.09 1.10 1.11 1.12 1.13 1.14 1.15 1.16 1.17 1.18 1.19 0.316 0.319 0.321 0.324 0.326 0.329 0.331 0.334 0.336 0.339 0.341 0.344 0.346 0.348 0.351 0.353 0.355 0.358 0.360 0.362 0.364 0.367 0.369 0.371 0.373 0.375 0.377 0.379 0.381 0.383 1.20 1.21 1.22 1.23 1.24 1.25 1.26 1.27 1.28 1.29 1.30 1.31 1.32 1.33 1.34 1.35 1.36 1.37 1.38 1.39 1.40 1.41 1.42 1.43 1.44 1.45 1.46 1.47 1.48 1.49 0.385 0.387 0.389 0.391 0.393 0.394 0.396 0.398 0.400 0.401 0.403 0.405 0.407 0.408 0.410 0.411 0.413 0.415 0.416 0.418 0.419 0.421 0.422 0.424 0.425 0.426 0.428 0.429 0.431 0.432 1.50 1.51 1.52 1.53 1.54 1.55 1.56 1.57 1.58 1.59 1.60 1.61 1.62 1.63 1.64 1.65 1.66 1.67 1.68 1.69 1.70 1.71 1.72 1.73 1.74 1.75 1.76 1.77 1.78 1.79 0.433 0.434 0.436 0.437 0.438 0.439 0.441 0.442 0.443 0.444 0.445 0.446 0.447 0.448 0.449 0.451 0.452 0.453 0.454 0.454 0.455 0.456 0.457 0.458 0.459 0.460 0.461 0.462 0.462 0.463 Areas under the Normal Curve The column under A gives the proportion of the area under the entire curve that is between z=0 and a positive value of z. Because the curve is symmetric about 0, the area betweenz=0 and a negative value of z can be found by using the corresponding positive value of z. こ 0.499 0.499 0.499 0.499 0.499 0.499 0.499 0.499 0.499 0.499 0.499 0.499 0.499 0.499 0.499 0.499 0.499 0.499 0.499 0.499 0.499 0.499 0.499 0.499 0.499 0.499 0.499 0.499 0.499 0.499 3.30 3.31 3.32 3.33 3.34 3.35 3.36 3.37 3.38 3.39 3.40 3.41 3.42 3.43 3.44 3.45 3.46 3.47 3.48 3.49 3.50 3.51 3.52 3.53 3.54 3.55 3.56 3.57 3.58 3.59 0.500 0.500 0.500 0.500 0.500 0.500 0.500 0.500 0.500 0.500 0.500 0.500 0.500 0.500 0.500 0.500 0.500 0.500 0.500 0.500 0.500 0.500 0.500 0.500 0.500 0.500 0.500 0.500 0.500 0.500 0.482 2.40 0.483 2.41 0.483 2.42 0.483 2.43 0.484 2.44 0.484 2.45 0.485 2.46 2.47 0.485 0.485 2.48 2.49 0.486 0.486 2.50 0.492 0.492 0.492 0.492 0.493 0.493 0.493 0.493 0.493 0.494 0.494 0.494 0.494 0.494 0.494 0.495 0.495 0.495 0.495 0.495 0.495 0.495 0.496 0.496 0.496 0.496 0.496 0.496 0.496 0.496 2.70 2.71 2.72 2.73 2.74 2.75 2.76 2.77 2.78 2.79 2.80 2.81 2.82 2.83 2.84 2.85 2.86 2.87 2.88 2.89 2.90 2.91 2.92 2.93 2.94 2.95 2.96 2.97 2.98 2.99 0.497 3.00 1.80 1.81 1.82 1.83 1.84 1.85 1.86 1.87 1.88 1.89 1.90 1.91 1.92 1.93 1.94 1.95 1.96 1.97 1.98 1.99 2.00 2.01 2.02 2.03 2.04 2.05 2.06 2.07 2.08 2.09 0.464 0.465 0.466 0.466 0.467 0.468 0.469 0.469 0.470 0.471 0.471 0.472 0.473 0.473 0.474 0.474 0.475 0.476 0.476 0.477 0.477 0.478 0.478 0.479 0.479 0.480 0.480 0.481 0.481 0.482 2.10 2.11 2.12 2.13 2.14 2.15 2.16 2.17 2.18 2.19 2.20 2.21 2.22 2.23 2.24 2.25 2.26 2.27 2.28 2.29 2.30 2.31 2.32 2.33 2.34 2.35 2.36 2.37 2.38 2.39 0.497 3.01 0.497 3.02 0.497 3.03 0.497 3.04 0.497 3.05 0.497 3.06 0.497 3.07 0.497 3.08 0.497 3.09 0.497 3.10 3.11 0.498 3.12 0.498 0.498 3.13 0.498 3.14 3.15 0.498 0.498 3.16 0.498 3.17 3.18 0.498 0.498 3.19 0.498 3.20 0.498 3.21 0.498 3.22 0.498 3.23 0.498 3.24 0.498 3.25 0.498 3.26 0.499 3.27 0.499 3.28 0.499 3.29 0.486 2.51 0.487 2.52 0.487 2.53 0.487 0.488 2.54 2.55 0.488 2.56 0.488 0.489 0.489 0.489 2.57 2.58 2.59 2.60 0.490 2.61 0.490 0.490 0.490 0.491 0.491 2.62 2.63 2.64 2.65 2.66 0.491 2.67 0.491 0.492 2.68 2.69

A First Course in Probability (10th Edition)
10th Edition
ISBN:9780134753119
Author:Sheldon Ross
Publisher:Sheldon Ross
Chapter1: Combinatorial Analysis
Section: Chapter Questions
Problem 1.1P: a. How many different 7-place license plates are possible if the first 2 places are for letters and...

Related questions

Question
A fruit-packing company produced peaches last summer whose weights were
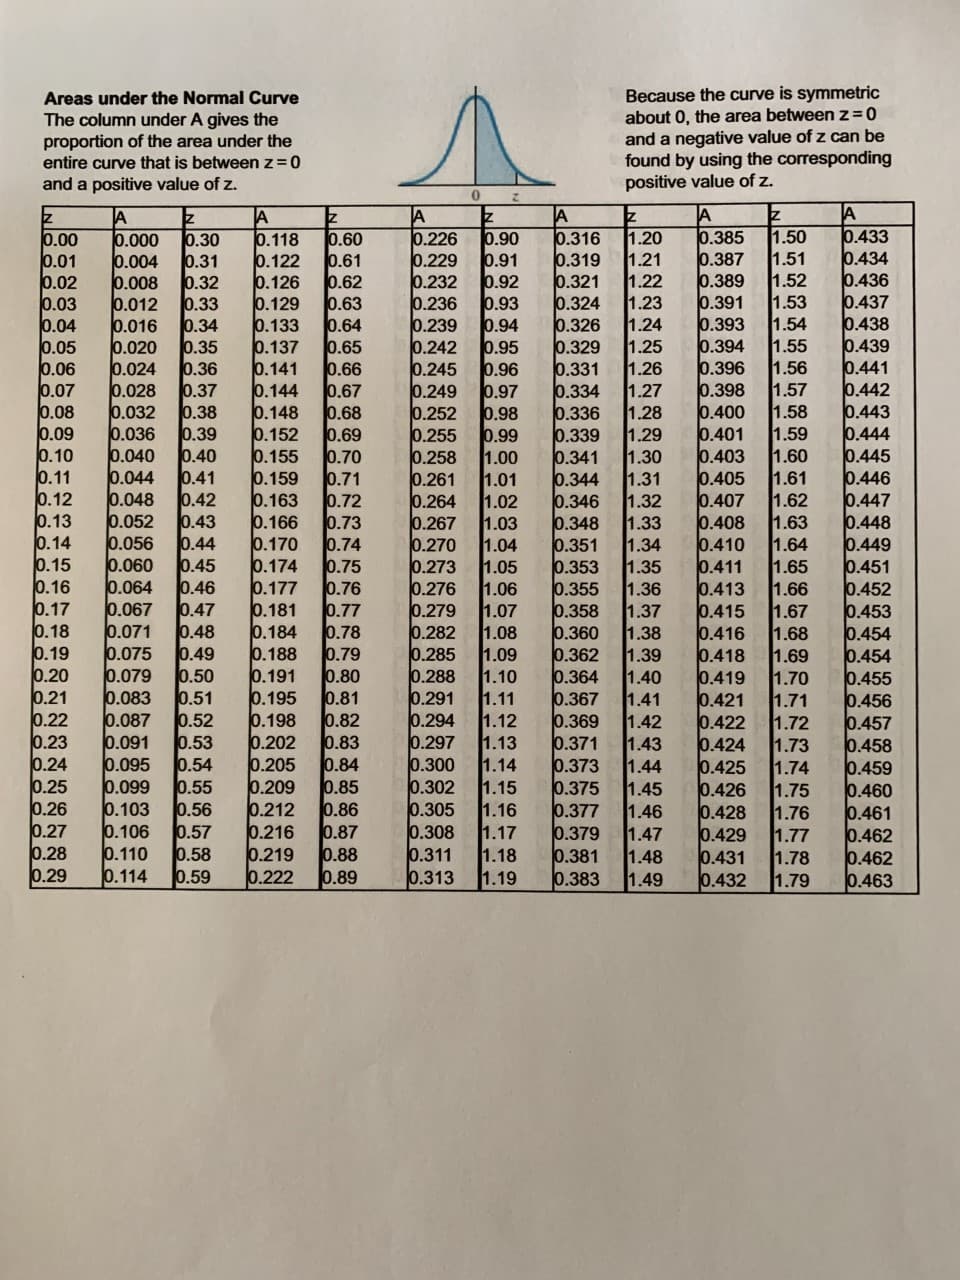
Transcribed Image Text:Areas under the Normal Curve
The column under A gives the
proportion of the area under the
entire curve that is betweenz=0
and a positive value of z.
Because the curve is symmetric
about 0, the area between z=0
and a negative value of z can I
found by using the corresponding
positive value of z.
0.00
0.01
0.02
0.03
0.04
0.05
0.06
0.07
0.08
0.09
0.10
0.11
0.12
0.13
0.14
0.15
0.16
0.17
0.18
0.19
0.20
0.21
0.22
0.23
0.24
0.25
0.26
0.27
0.28
0.29
0.000
0.004
0.008
0.012
0.016
0.020
0.024
0.028
0.032
0.036
0.040
0.044
0.048
0.052
0.056
0.060
0.064
0.067
0.071
0.075
0.079
0.083
0.087
0.091
0.095
0.099
0.103
0.106
0.110
0.114
0.30
0.31
0.32
0.33
0.34
0.35
0.36
0.37
0.38
0.39
0.40
0.41
0.42
0.43
0.44
0.45
0.46
0.47
0.48
0.49
0.50
0.51
0.52
0.53
0.54
0.55
0.56
0.57
0.58
0.59
0.118
0.122
0.126
0.129
0.133
0.137
0.141
0.144
0.148
0.152
0.155
0.159
0.163
0.166
0.170
0.174
0.177
0.181
0.184
0.188
0.191
0.195
0.198
0.202
0.205
0.209
0.212
0.216
0.219
0.222
0.60
0.61
0.62
0.63
0.64
0.65
0.66
0.67
0.68
0.69
0.70
0.71
0.72
0.73
0.74
0.75
0.76
0.77
0.78
0.79
0.80
0.81
0.82
0.83
0.84
0.85
0.86
0.87
0.88
0.89
0.226
0.229
0.232
0.236
0.239
0.242
0.245
0.249
0.252
0.255
0.258
0.261
0.264
0.267
0.270
0.273
0.276
0.279
0.282
0.285
0.288
0.291
0.294
0.297
0.300
0.302
0.305
0.308
0.311
0.313
0.90
0.91
0.92
0.93
0.94
0.95
0.96
0.97
0.98
0.99
1.00
1.01
1.02
1.03
1.04
1.05
1.06
1.07
1.08
1.09
1.10
1.11
1.12
1.13
1.14
1.15
1.16
1.17
1.18
1.19
0.316
0.319
0.321
0.324
0.326
0.329
0.331
0.334
0.336
0.339
0.341
0.344
0.346
0.348
0.351
0.353
0.355
0.358
0.360
0.362
0.364
0.367
0.369
0.371
0.373
0.375
0.377
0.379
0.381
0.383
1.20
1.21
1.22
1.23
1.24
1.25
1.26
1.27
1.28
1.29
1.30
1.31
1.32
1.33
1.34
1.35
1.36
1.37
1.38
1.39
1.40
1.41
1.42
1.43
1.44
1.45
1.46
1.47
1.48
1.49
0.385
0.387
0.389
0.391
0.393
0.394
0.396
0.398
0.400
0.401
0.403
0.405
0.407
0.408
0.410
0.411
0.413
0.415
0.416
0.418
0.419
0.421
0.422
0.424
0.425
0.426
0.428
0.429
0.431
0.432
1.50
1.51
1.52
1.53
1.54
1.55
1.56
1.57
1.58
1.59
1.60
1.61
1.62
1.63
1.64
1.65
1.66
1.67
1.68
1.69
1.70
1.71
1.72
1.73
1.74
1.75
1.76
1.77
1.78
1.79
0.433
0.434
0.436
0.437
0.438
0.439
0.441
0.442
0.443
0.444
0.445
0.446
0.447
0.448
0.449
0.451
0.452
0.453
0.454
0.454
0.455
0.456
0.457
0.458
0.459
0.460
0.461
0.462
0.462
0.463
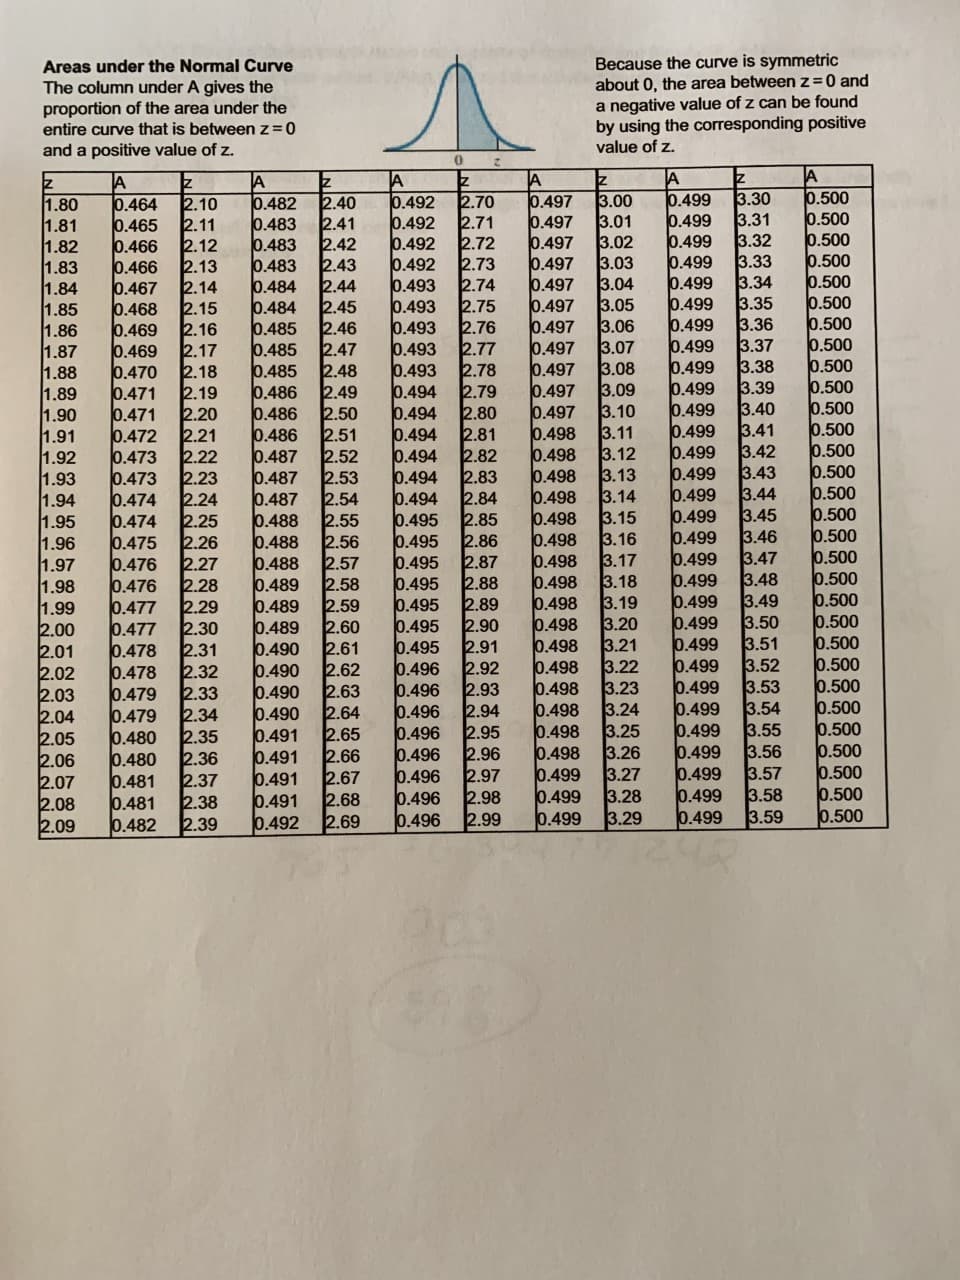
Transcribed Image Text:Areas under the Normal Curve
The column under A gives the
proportion of the area under the
entire curve that is between z=0
and a positive value of z.
Because the curve is symmetric
about 0, the area betweenz=0 and
a negative value of z can be found
by using the corresponding positive
value of z.
こ
0.499
0.499
0.499
0.499
0.499
0.499
0.499
0.499
0.499
0.499
0.499
0.499
0.499
0.499
0.499
0.499
0.499
0.499
0.499
0.499
0.499
0.499
0.499
0.499
0.499
0.499
0.499
0.499
0.499
0.499
3.30
3.31
3.32
3.33
3.34
3.35
3.36
3.37
3.38
3.39
3.40
3.41
3.42
3.43
3.44
3.45
3.46
3.47
3.48
3.49
3.50
3.51
3.52
3.53
3.54
3.55
3.56
3.57
3.58
3.59
0.500
0.500
0.500
0.500
0.500
0.500
0.500
0.500
0.500
0.500
0.500
0.500
0.500
0.500
0.500
0.500
0.500
0.500
0.500
0.500
0.500
0.500
0.500
0.500
0.500
0.500
0.500
0.500
0.500
0.500
0.482
2.40
0.483
2.41
0.483
2.42
0.483
2.43
0.484
2.44
0.484
2.45
0.485
2.46
2.47
0.485
0.485
2.48
2.49
0.486
0.486 2.50
0.492
0.492
0.492
0.492
0.493
0.493
0.493
0.493
0.493
0.494
0.494
0.494
0.494
0.494
0.494
0.495
0.495
0.495
0.495
0.495
0.495
0.495
0.496
0.496
0.496
0.496
0.496
0.496
0.496
0.496
2.70
2.71
2.72
2.73
2.74
2.75
2.76
2.77
2.78
2.79
2.80
2.81
2.82
2.83
2.84
2.85
2.86
2.87
2.88
2.89
2.90
2.91
2.92
2.93
2.94
2.95
2.96
2.97
2.98
2.99
0.497
3.00
1.80
1.81
1.82
1.83
1.84
1.85
1.86
1.87
1.88
1.89
1.90
1.91
1.92
1.93
1.94
1.95
1.96
1.97
1.98
1.99
2.00
2.01
2.02
2.03
2.04
2.05
2.06
2.07
2.08
2.09
0.464
0.465
0.466
0.466
0.467
0.468
0.469
0.469
0.470
0.471
0.471
0.472
0.473
0.473
0.474
0.474
0.475
0.476
0.476
0.477
0.477
0.478
0.478
0.479
0.479
0.480
0.480
0.481
0.481
0.482
2.10
2.11
2.12
2.13
2.14
2.15
2.16
2.17
2.18
2.19
2.20
2.21
2.22
2.23
2.24
2.25
2.26
2.27
2.28
2.29
2.30
2.31
2.32
2.33
2.34
2.35
2.36
2.37
2.38
2.39
0.497
3.01
0.497
3.02
0.497
3.03
0.497
3.04
0.497
3.05
0.497
3.06
0.497
3.07
0.497
3.08
0.497
3.09
0.497
3.10
3.11
0.498
3.12
0.498
0.498
3.13
0.498
3.14
3.15
0.498
0.498
3.16
0.498
3.17
3.18
0.498
0.498
3.19
0.498
3.20
0.498
3.21
0.498
3.22
0.498
3.23
0.498
3.24
0.498
3.25
0.498
3.26
0.499
3.27
0.499
3.28
0.499 3.29
0.486
2.51
0.487
2.52
0.487
2.53
0.487
0.488
2.54
2.55
0.488
2.56
0.488
0.489
0.489
0.489
2.57
2.58
2.59
2.60
0.490
2.61
0.490
0.490
0.490
0.491
0.491
2.62
2.63
2.64
2.65
2.66
0.491
2.67
0.491
0.492
2.68
2.69
Expert Solution
This question has been solved!
Explore an expertly crafted, step-by-step solution for a thorough understanding of key concepts.

This is a popular solution!

Trending now
This is a popular solution!

Step by step
Solved in 3 steps with 3 images

Knowledge Booster


Learn more about
Need a deep-dive on the concept behind this application? Look no further. Learn more about this topic, probability and related others by exploring similar questions and additional content below.Recommended textbooks for you
A First Course in Probability (10th Edition)
Probability
ISBN:
9780134753119
Author:
Sheldon Ross
Publisher:
PEARSON

A First Course in Probability (10th Edition)
Probability
ISBN:
9780134753119
Author:
Sheldon Ross
Publisher:
PEARSON