Asoft-drink manufacturer claims that its 12-ounce cans do not contain, on average, more than 30 calories. A random sample of 62 cans of this soft drink, which were checked for calories, contained a mean of 32 calories with a standard deviation of 3 calories. Doe the sample information support the alternative hypothesis that the manufacturer's claim is false? Use a significance level of 5%. Fin the range for the p-value for this test. What will your conclusion be using this p-value and a = 0.05? Use the t distribution table to find a range for the p-value. The sample information supports the alternative hypothesis.
Asoft-drink manufacturer claims that its 12-ounce cans do not contain, on average, more than 30 calories. A random sample of 62 cans of this soft drink, which were checked for calories, contained a mean of 32 calories with a standard deviation of 3 calories. Doe the sample information support the alternative hypothesis that the manufacturer's claim is false? Use a significance level of 5%. Fin the range for the p-value for this test. What will your conclusion be using this p-value and a = 0.05? Use the t distribution table to find a range for the p-value. The sample information supports the alternative hypothesis.

Glencoe Algebra 1, Student Edition, 9780079039897, 0079039898, 2018
18th Edition
ISBN:9780079039897
Author:Carter
Publisher:Carter
Chapter10: Statistics
Section10.4: Distributions Of Data
Problem 7PPS

Related questions
Topic Video
Question
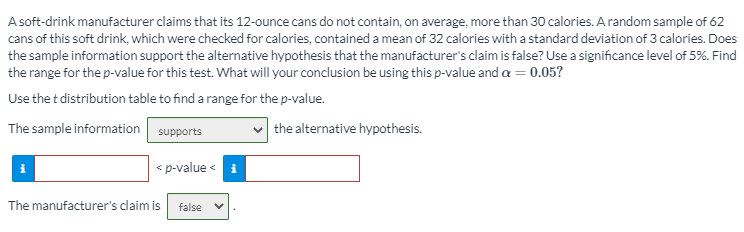
Transcribed Image Text:A soft-drink manufacturer claims that its 12-ounce cans do not contain, on average, more than 30 calories. Arandom sample of 62
cans of this soft drink, which were checked for calories, contained a mean of 32 calories with a standard deviation of 3 calories. Does
the sample information support the alternative hypothesis that the manufacturer's claim is false? Use a significance level of 5%. Find
the range for the p-value for this test. What will your conclusion be using this p-value and a = 0.05?
Use the t distribution table to find a range for the p-value.
The sample information supports
the alternative hypothesis.
< p-value <
i
The manufacturer's claim is
false
Expert Solution
This question has been solved!
Explore an expertly crafted, step-by-step solution for a thorough understanding of key concepts.

This is a popular solution!

Trending now
This is a popular solution!

Step by step
Solved in 2 steps

Knowledge Booster


Learn more about
Need a deep-dive on the concept behind this application? Look no further. Learn more about this topic, statistics and related others by exploring similar questions and additional content below.Recommended textbooks for you
Glencoe Algebra 1, Student Edition, 9780079039897…
Algebra
ISBN:
9780079039897
Author:
Carter
Publisher:
McGraw Hill
Glencoe Algebra 1, Student Edition, 9780079039897…
Algebra
ISBN:
9780079039897
Author:
Carter
Publisher:
McGraw Hill