Assets ITEM Total Cash & Due from Banks Cash & Due from Banks Growth Investments - Total Investments Growth Trading Account Securities Federal Funds Sold & Securities Purchased Federal Funds Sold 2018 269.44B 371.88B 4.03B 34.29B 2019 255.1B -5.32% 371.28B -0.16% 2.93B 22.56B 2020 261.17B 2.38% 439.25B 18.31% 4.51B 30.25B Fiscal year is January-December. All values PH 2022 5-YEAR TREND 2021 303.97B 16.39% 522.2B 18.88% 3.55B 30.9B
Assets ITEM Total Cash & Due from Banks Cash & Due from Banks Growth Investments - Total Investments Growth Trading Account Securities Federal Funds Sold & Securities Purchased Federal Funds Sold 2018 269.44B 371.88B 4.03B 34.29B 2019 255.1B -5.32% 371.28B -0.16% 2.93B 22.56B 2020 261.17B 2.38% 439.25B 18.31% 4.51B 30.25B Fiscal year is January-December. All values PH 2022 5-YEAR TREND 2021 303.97B 16.39% 522.2B 18.88% 3.55B 30.9B

Financial Accounting: The Impact on Decision Makers
10th Edition
ISBN:9781305654174
Author:Gary A. Porter, Curtis L. Norton
Publisher:Gary A. Porter, Curtis L. Norton
Chapter10: Long-term Liabilities
Section: Chapter Questions
Problem 10.10E

Related questions
Question
Please answer the asset management ratio of BPI from year 2018 - 2021.
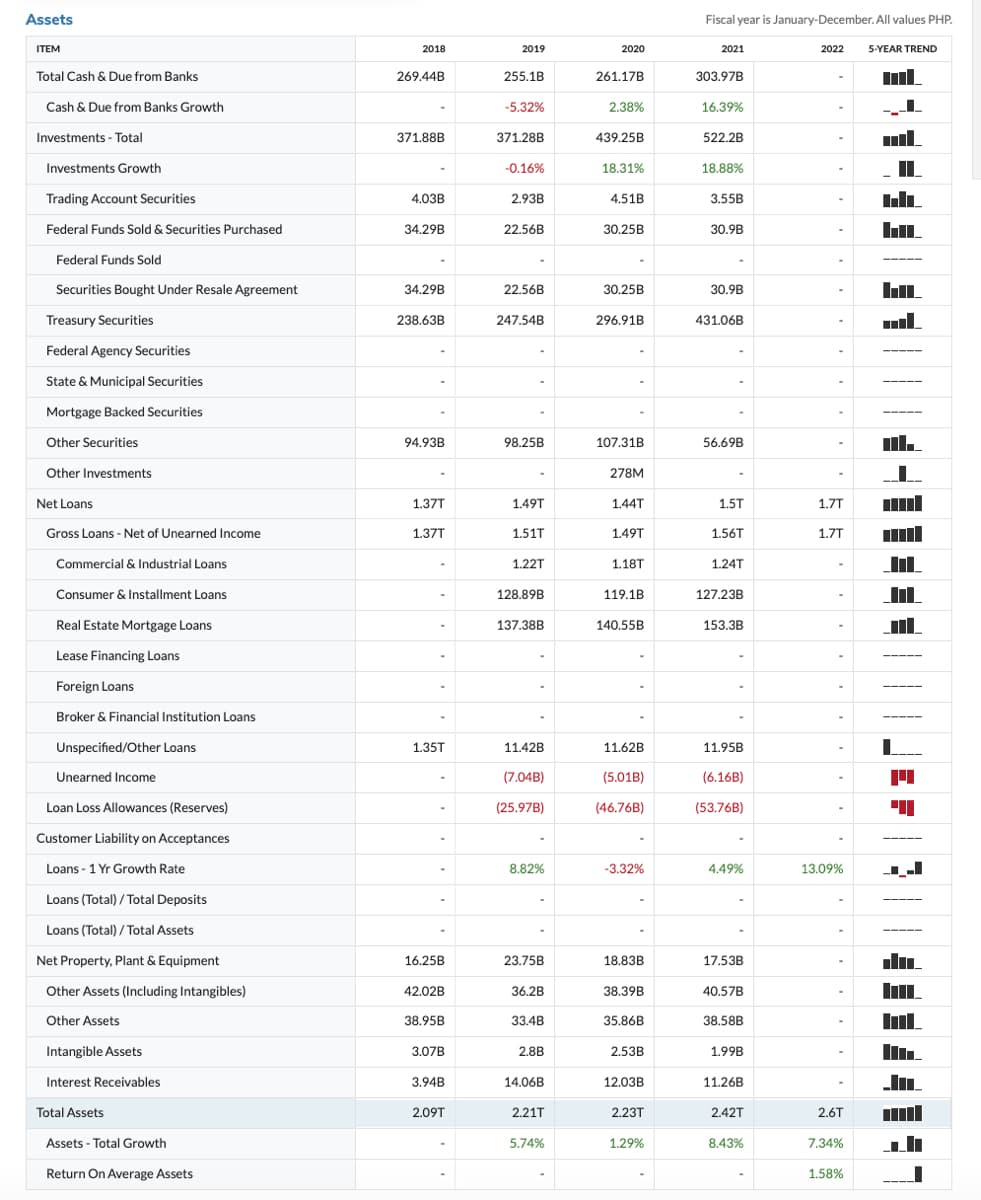
Transcribed Image Text:Assets
ITEM
Total Cash & Due from Banks
Cash & Due from Banks Growth
Investments - Total
Investments Growth
Trading Account Securities
Federal Funds Sold & Securities Purchased
Federal Funds Sold
Securities Bought Under Resale Agreement
Treasury Securities
Federal Agency Securities
State & Municipal Securities
Mortgage Backed Securities
Other Securities
Other Investments
Net Loans
Gross Loans - Net of Unearned Income
Commercial & Industrial Loans
Consumer & Installment Loans
Real Estate Mortgage Loans
Lease Financing Loans
Foreign Loans
Broker & Financial Institution Loans
Unspecified/Other Loans
Unearned Income
Loan Loss Allowances (Reserves)
Customer Liability on Acceptances
Loans - 1 Yr Growth Rate
Loans (Total) / Total Deposits
Loans (Total) / Total Assets
Net Property, Plant & Equipment
Other Assets (Including Intangibles)
Other Assets
Intangible Assets
Interest Receivables
Total Assets
Assets - Total Growth
Return On Average Assets
2018
269.44B
371.88B
4.03B
34.29B
34.29B
238.63B
94.93B
1.37T
1.37T
1.35T
16.25B
42.02B
38.95B
3.07B
3.94B
2.09T
2019
255.1B
-5.32%
371.28B
-0.16%
2.93B
22.56B
22.56B
247.54B
98.25B
1.49T
1.517
1.22T
128.89B
137.38B
11.42B
(7.04B)
(25.97B)
8.82%
23.75B
36.2B
33.4B
2.8B
14.06B
2.21T
5.74%
2020
261.17B
2.38%
439.25B
18.31%
4.51B
30.25B
30.25B
296.91B
107.31B
278M
1.44T
1.49T
1.18T
119.1B
140.55B
11.62B
(5.01B)
(46.76B)
-3.32%
18.83B
38.39B
35.86B
2.53B
12.03B
2.23T
1.29%
Fiscal year is January-December. All values PHP.
2022 5-YEAR TREND
2021
303.97B
16.39%
522.2B
18.88%
3.55B
30.9B
30.9B
431.06B
56.69B
1.5T
1.56T
1.24T
127.23B
153.3B
11.95B
(6.16B)
(53.76B)
4.49%
17.53B
40.57B
38.58B
1.99B
11.26B
2.42T
8.43%
1.7T
1.7T
-
13.09%
-
2.6T
7.34%
1.58%
I
HL
M
▬▬▬▬▬
||
"
‒‒‒‒‒
th
![2011 and 2013 their current ratio was lowest. But it started to get stable at 2014.
A. Asset Management Ratio
2021
Inventory Turnover
Days sales Outstanding
(DSO)
Fixed Asset Turnover
[WRITE YOUR ANALYSIS HERE]
Total asset turnover
B. Debt Management Ratio
2020
2021
2019
Bar graph
[WRITE YOUR ANALYSIS HERE]
2020
2018
2019
2018
2017
2017
2016
2016](/v2/_next/image?url=https%3A%2F%2Fcontent.bartleby.com%2Fqna-images%2Fquestion%2Fc06ee947-bff6-4f67-a78d-d36f542fcca2%2F19833754-203d-4e81-bfd5-8fc88a456867%2Fjze3bkq_processed.jpeg&w=3840&q=75)
Transcribed Image Text:2011 and 2013 their current ratio was lowest. But it started to get stable at 2014.
A. Asset Management Ratio
2021
Inventory Turnover
Days sales Outstanding
(DSO)
Fixed Asset Turnover
[WRITE YOUR ANALYSIS HERE]
Total asset turnover
B. Debt Management Ratio
2020
2021
2019
Bar graph
[WRITE YOUR ANALYSIS HERE]
2020
2018
2019
2018
2017
2017
2016
2016
Expert Solution
This question has been solved!
Explore an expertly crafted, step-by-step solution for a thorough understanding of key concepts.

Step by step
Solved in 3 steps

Recommended textbooks for you
Financial Accounting: The Impact on Decision Make…
Accounting
ISBN:
9781305654174
Author:
Gary A. Porter, Curtis L. Norton
Publisher:
Cengage Learning
Financial Accounting: The Impact on Decision Make…
Accounting
ISBN:
9781305654174
Author:
Gary A. Porter, Curtis L. Norton
Publisher:
Cengage Learning