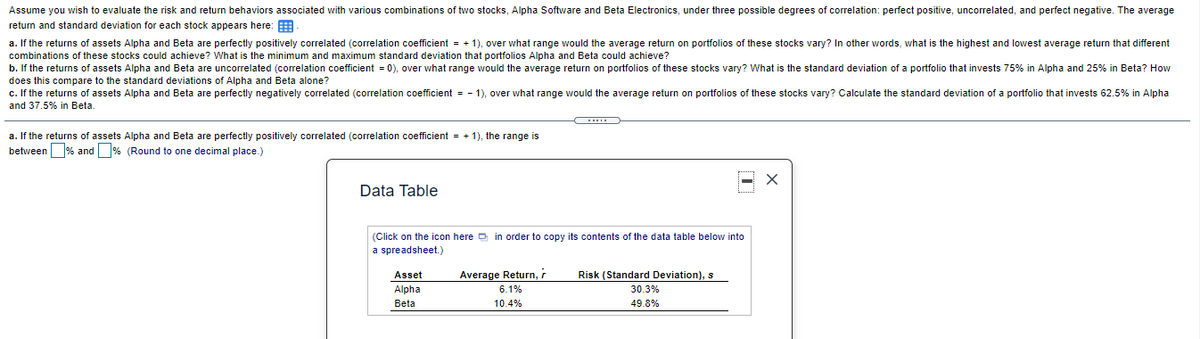
Assume you wish to evaluate the risk and return behaviors associated with various combinations of two stocks, Alpha Software and Beta Electronics, under three possible degrees of correlation: perfect positive, uncorrelated, and perfect negative. The average retum and standard deviation for each stock appears here: E a. If the returns of assets Alpha and Beta are perfectly positively correlated (correlation coefficient = + 1), over what range would the average return on portfolios of these stocks vary? In other words, what is the highest and lowest average return that different combinations of these stocks could achieve? What is the minimum and maximum standard deviation that portfolios Alpha and Beta could achieve? b. If the returns of assets Alpha and Beta are uncorrelated (correlation coefficient = 0), over what range would the average return on portfolios of these stocks vary? What is the standard deviation of a portfolio that invests 75% in Alpha and 25% in Beta? How does this compare to the standard deviations of Alpha and Beta alone? c. If the returns of assets Alpha and Beta are perfectly negatively correlated (correlation coefficient = - 1), over what range would the average return on portfolios of these stocks vary? Calculate the standard deviation of a portfolio that invests 62.5% in Alpha s of and 37.5% in Beta. a. If the returns of assets Alpha and Beta are perfectly positively correlated (correlation coefficient -+ 1), the range is between % and % (Round to one decimal place.) Data Table (Click on the icon here D in order to copy its contents of the data table below into a spreadsheet.) Asset Average Return,r Risk (Standard Deviation), s Alpha 6.1% 30.3% Beta 10.4% 49.8%
Assume you wish to evaluate the risk and return behaviors associated with various combinations of two stocks, Alpha Software and Beta Electronics, under three possible degrees of correlation: perfect positive, uncorrelated, and perfect negative. The average retum and standard deviation for each stock appears here: E a. If the returns of assets Alpha and Beta are perfectly positively correlated (correlation coefficient = + 1), over what range would the average return on portfolios of these stocks vary? In other words, what is the highest and lowest average return that different combinations of these stocks could achieve? What is the minimum and maximum standard deviation that portfolios Alpha and Beta could achieve? b. If the returns of assets Alpha and Beta are uncorrelated (correlation coefficient = 0), over what range would the average return on portfolios of these stocks vary? What is the standard deviation of a portfolio that invests 75% in Alpha and 25% in Beta? How does this compare to the standard deviations of Alpha and Beta alone? c. If the returns of assets Alpha and Beta are perfectly negatively correlated (correlation coefficient = - 1), over what range would the average return on portfolios of these stocks vary? Calculate the standard deviation of a portfolio that invests 62.5% in Alpha s of and 37.5% in Beta. a. If the returns of assets Alpha and Beta are perfectly positively correlated (correlation coefficient -+ 1), the range is between % and % (Round to one decimal place.) Data Table (Click on the icon here D in order to copy its contents of the data table below into a spreadsheet.) Asset Average Return,r Risk (Standard Deviation), s Alpha 6.1% 30.3% Beta 10.4% 49.8%

Financial Management: Theory & Practice
16th Edition
ISBN:9781337909730
Author:Brigham
Publisher:Brigham
Chapter25: Portfolio Theory And Asset Pricing Models
Section: Chapter Questions
Problem 4MC: You have been hired at the investment firm of Bowers Noon. One of its clients doesnt understand the...

Related questions
Question
Transcribed Image Text:Assume you wish to evaluate the risk and return behaviors associated with various combinations of two stocks, Alpha Software and Beta Electronics, under three possible degrees of correlation: perfect positive, uncorrelated, and perfect negative. The average
return and standard deviation for each stock appears here:
a. If the returns of assets Alpha and Beta are perfectly positively correlated (correlation coefficient = + 1), over what range would the average return on portfolios of these stocks vary? In other words, what is the highest and lowest average return that different
combinations of these stocks could achieve? What is the minimum and maximum standard deviation that portfolios Alpha and Beta could achieve?
b. If the returns of assets Alpha and Beta are uncorrelated (correlation coefficient = 0), over what range would the average return on portfolios of these stocks vary? What is the standard deviation of a portfolio that invests 75% in Alpha and 25% in Beta? How
does this compare to the standard deviations of Alpha and Beta alone?
c. If the returns of assets Alpha and Beta are perfectly negatively correlated (correlation coefficient = - 1), over what range would the average return on portfolios of these stocks vary? Calculate the standard deviation of a portfolio that invests 62.5% in Alpha
and 37.5% in Beta.
a. If the returns of assets Alpha and Beta are perfectly positively correlated (correlation coefficient = + 1), the range is
between % and % (Round to one decimal place.)
Data Table
(Click on the icon here e in order to copy its contents of the data table below into
a spreadsheet.)
Asset
Average Return,
Risk (Standard Deviation), s
30.3%
Alpha
6.1%
Beta
10.4%
49.8%
Expert Solution
This question has been solved!
Explore an expertly crafted, step-by-step solution for a thorough understanding of key concepts.

This is a popular solution!

Trending now
This is a popular solution!

Step by step
Solved in 2 steps

Recommended textbooks for you

Intermediate Financial Management (MindTap Course…
Finance
ISBN:
9781337395083
Author:
Eugene F. Brigham, Phillip R. Daves
Publisher:
Cengage Learning

EBK CONTEMPORARY FINANCIAL MANAGEMENT
Finance
ISBN:
9781337514835
Author:
MOYER
Publisher:
CENGAGE LEARNING - CONSIGNMENT
Intermediate Financial Management (MindTap Course…
Finance
ISBN:
9781337395083
Author:
Eugene F. Brigham, Phillip R. Daves
Publisher:
Cengage Learning
EBK CONTEMPORARY FINANCIAL MANAGEMENT
Finance
ISBN:
9781337514835
Author:
MOYER
Publisher:
CENGAGE LEARNING - CONSIGNMENT
