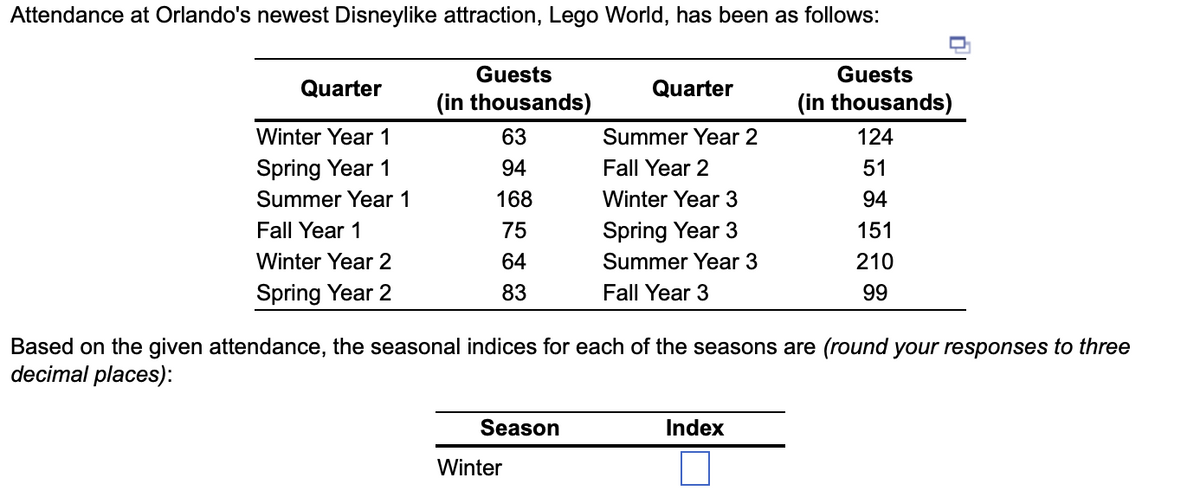
Attendance at Orlando's newest Disneylike attraction, Lego World, has been as follows: Guests (in thousands) 63 94 168 Quarter Winter Year 1 Spring Year 1 Summer Year 1 Fall Year 1 Winter Year 2 Spring Year 2 75 64 83 Season Quarter Winter Summer Year 2 Fall Year 2 Winter Year 3 Spring Year 3 Summer Year 3 Fall Year 3 Based on the given attendance, the seasonal indices for each of the seasons are (round your responses to three decimal places): Guests (in thousands) Index 124 51 94 151 210 99


Q: The Peace Department of Shalom Company uses 5,000 kilograms per month in its production of Peace…
A: Whether you choose to purchase the material from external vendors or from inside the organization…
Q: Why would a company risk its safety by letting employees bring their own gadgets to work?
A: The ability to work from anywhere is no longer a luxury in today's always-connected society, but a…
Q: Cranberries can be harvested using either a "wet" method or "dry" method. Dry-harvested cranberries…
A: Decision Variables: Suppose-W = barrels of cranberries harvested using wet methodD = barrels of…
Q: As operations manager of Holz Furniture, you must make a decision about adding a line of rustic…
A: A Decision tree is a tool which helps to represent a problem graphically by considering all possible…
Q: Assume that you have been selected as part of a group and hired by the FAO to manage this FAO Funded…
A: Being a part of the FAO Funded Aquaponics project team is liable for guaranteeing that the aquaponic…
Q: 10. Consider a single-server queueing system where interarrival times have an exponential…
A: Given: Inter-arrival time =λService times=μWaiting time before reneging = 1θ
Q: I. WEBSITE DESIGN During discussion both you and Rissa have determined that the following activities…
A: Introduction The steps required to finish a project may be shown in a network diagram. In most…
Q: Scenario -- Diamond Business Offices The following information was gained from an interview with the…
A: The Diamond Business Offices case study highlights the critical risks associated with expanding and…
Q: Provide an example of a design heuristic that improves the process of giving consumers feedback.…
A: Consumer feedback is fundamental for any business to work on its items, administrations, and general…
Q: RSM Botswana delivers facilitation and consulting services to Government and parastatal clients.…
A: As the business development manager at Letlole Group of Companies, it is important to provide a…
Q: The following are the three pillars upon which every functional and productive network is built:…
A: Functional and productive organizations are those that are well-designed and efficiently managed to…
Q: 1.2. capacity Identify two (2) reasons why organisations operate below their maximum processing
A: Each business must effectively use its resources to accomplish its goals and objectives. Companies…
Q: Based upon Six Sigma theory, how would you rate this performance, other things being equal? (Round…
A: The total number of parts is 1500, 1477 parts don't include any defect The number of…
Q: how to calculate average inventory and average inventory value
A: To calculate the average inventory,add up the value of inventory at the beginning of each period…
Q: Discuss the four (4) potential issues namely (a) Marketing Issues, (b)Financial & Accounting Issues…
A: To address these four potential issues within the strategic implementation, the group should conduct…
Q: Case Discussion Smithfield Custom Furniture (Part 2) As a result of its consultants' wonderful…
A: Smithfield Custom Furniture, a company with a long history of success, has been targeting the…
Q: a. 120 units of end item Z are needed at the beginning of week 7. On hand balances: Z = 40, A 70, B…
A: Given product structure tree-
Q: Why would it be a waste of effort to segment a larger design into consumers' specific needs
A: Segmenting a larger design into consumers' specific needs might appear to be a logical methodology…
Q: How does one using the cultural relativism explain what is right and wrong?
A: Cultural relativism is the idea that moral and ethical systems can only be understood and judged…
Q: Define "benchmarking" and describe its purpose
A: Here, as per this Q, I would first explain the definition of benchmarking, then, I would include the…
Q: Given is a decision payoff table. Alternatives Small Facility Medium Facility Large Facility Low 26…
A: Given-
Q: SHORT CASE STUDIES ON SUPPLY CHAIN DECISIONS 1. Identify the transportation network structure in…
A: The transportation network structure is a significant supply chain decision that decides how…
Q: Johnson's Artisan Bakery is experimenting with two new croissant recipes. One recipe calls for 302.5…
A: Linear programming model helps to identify the optimal value based on the consideration of all given…
Q: FAO-Funded Aquaponics Project Launched In Barbados Barbados GIS – The United Nations Food and…
A: Project management includes all those activities that are important for the successful completion of…
Q: I was wondering what the upsides of automating shipping company spreadsheets may be.
A: Automating shipping company spreadsheets involves using software and tools to automate various tasks…
Q: 2018 2019 Quality Costs (000s) Prevention $3.2 10.7 28.3 42.6 50.0 Appraisal…
A: Total Quality Cost= Prevention + Appraisal + Internal Failure + external Failure
Q: Cairney, Incorporated manufactures a specialized part used in internal combustion engines. The…
A: Annual Demand- 249,000 units Practical capacity- 264,000 units annually Annual cost of facility-…
Q: Table 1 below describes reported project status data in week 8 for the Beta project. The Beta…
A: Find the Calculation methods below: Budget At Completion = Total of BCWSPlanned Value = BAC x…
Q: 1. Study the supply chain integration of companies operating in Namibia below and identify the TYPE…
A: Supply chain integration is one more sort of integration that includes the integration of various…
Q: A company hires you to develop a linear regression forecasting model. Based on the company's…
A: The linear regression is determined with following formula: Y = a+bX Given that: a = 1500 b = -25 X…
Q: The following information was gained from an interview with the Managing Director (MD) of Diamond…
A: In an interview, the Managing Director (MD) of Diamond Business Offices, a provider of comprehensive…
Q: Section A - Please answer # 1. Draw a Network Diagram (Network Programming)
A: A network diagram is a graphical representation of a project which helps to identify the activity…
Q: You have determined that a 75 percent learning curve is appropriate to produce an item, and the…
A: Formulae used: For learning curve- Tn = T1 x nb Where, Tn = Time for the nth unitT1 = Time for the…
Q: While Microsoft has stopped providing security updates for Windows Server 2003, it is still being…
A: In today's business world, software and hardware have become integral components of most companies'…
Q: Visions are the "components" of successful projects. What's the point?
A: Visions play a important role in the success of any project. A vision is a clear picture of the…
Q: 12) The grouping of the offices by functional area is an example of a(n) A) good B) service C) input…
A: Strategic planning is a process to develop a plan of action to achieve them. It involves analyzing…
Q: A customer buys 1 ABC Jan 35 put for a premium of $3 and simultaneously buys 100 shares of ABC stock…
A: Customers have need to profit on stock purchase which is equal to the cost of the put premium…
Q: How can trends and patterns be identified to help with market forecasting
A: With the help of trends, we could show a general direction of marketing forecasted data or demand…
Q: Discuss a paragraph on Financial & Accounting Issues, incorporating into it -. Acquitting Capital,…
A: Financial and accounting issues are essential considerations for any new business in tourism sector.…
Q: PharmaPlus operates a chain of 30 pharmacies. The pharmacies are staffed by licensed pharmacists and…
A: Decision Variables: Suppose- P = No. of full-time equivalent pharmacistsT = No. of full-time…
Q: What have ERP, Business process and Leadership taught you, write 2 pages like a learning diary.
A: Below is the explanation of ERP, Business process and Leadership for learning diary:
Q: Describe the differences between planning for the short, the medium, and the long term scheduling.
A: Short-term planning focuses on immediate project goals and milestones, medium-term planning involves…
Q: It is evident that organizations must take advantage of opportunities, but in the context of a 20…
A: The 20-Mile March is one of the book's most interesting ideas. It expresses the notion that the most…
Q: Explain the basic compensation objectives of pay systems. Compensation systems can be tailored to…
A: NOTE: We are allowed to do the first three sub-parts only. Strategic management is the process of…
Q: A unit has a constant failure rate of 0.3% per 1000 hours. What is its MTBF? What are the…
A: MTBF stands for Mean Time Between Failures. It is a measure of the expected time between two…
Q: Cereal Manufacturer The plant manager of a cereal manufacturer is wondering if the company could…
A: Process control measures in statistics are techniques used to screen and control a process to…
Q: Please answer the parts in the case of the operational manager in the Human Resource department as…
A: CASE SUMMARY- The above-given case includes an insurance company, Insurance Ltd., that acknowledges…
Q: Product Mix TJ, Inc., makes three nut mixes for sale to grocery chains located in the Southeast.…
A: 1. If the extra nuts are going to be bought, these are some suggestions for increasing the overall…
Q: Use weighted average and the past four week's demand to predict next week demand. Demands for the…
A: Simple average is calculate with following method Simple average = Total demandN
Q: a. Differentiate between design capacity and capacity utilization. b. Briefly describe three…
A: Since you have posted multiple questions, we will provide the solution only to the first question as…


Trending now
This is a popular solution!

Step by step
Solved in 2 steps

- The management of a technology company is trying to determine the variable that best explains the variation of employee salaries using a sample of 52 full-time employees; see the file P13_08.xlsx. Estimate simple linear regression equations to identify which of the following has the strongest linear relationship with annual salary: the employees gender, age, number of years of relevant work experience prior to employment at the company, number of years of employment at the company, or number of years of post secondary education. Provide support for your conclusion.Suppose that a regional express delivery service company wants to estimate the cost of shipping a package (Y) as a function of cargo type, where cargo type includes the following possibilities: fragile, semifragile, and durable. Costs for 15 randomly chosen packages of approximately the same weight and same distance shipped, but of different cargo types, are provided in the file P13_16.xlsx. a. Estimate a regression equation using the given sample data, and interpret the estimated regression coefficients. b. According to the estimated regression equation, which cargo type is the most costly to ship? Which cargo type is the least costly to ship? c. How well does the estimated equation fit the given sample data? How might the fit be improved? d. Given the estimated regression equation, predict the cost of shipping a package with semifragile cargo.Stock market analysts are continually looking for reliable predictors of stock prices. Consider the problem of modeling the price per share of electric utility stocks (Y). Two variables thought to influence this stock price are return on average equity (X1) and annual dividend rate (X2). The stock price, returns on equity, and dividend rates on a randomly selected day for 16 electric utility stocks are provided in the file P13_15.xlsx. Estimate a multiple regression equation using the given data. Interpret each of the estimated regression coefficients. Also, interpret the standard error of estimate and the R-square value for these data.
- The owner of a restaurant in Bloomington, Indiana, has recorded sales data for the past 19 years. He has also recorded data on potentially relevant variables. The data are listed in the file P13_17.xlsx. a. Estimate a simple regression equation involving annual sales (the dependent variable) and the size of the population residing within 10 miles of the restaurant (the explanatory variable). Interpret R-square for this regression. b. Add another explanatory variableannual advertising expendituresto the regression equation in part a. Estimate and interpret this expanded equation. How does the R-square value for this multiple regression equation compare to that of the simple regression equation estimated in part a? Explain any difference between the two R-square values. How can you use the adjusted R-squares for a comparison of the two equations? c. Add one more explanatory variable to the multiple regression equation estimated in part b. In particular, estimate and interpret the coefficients of a multiple regression equation that includes the previous years advertising expenditure. How does the inclusion of this third explanatory variable affect the R-square, compared to the corresponding values for the equation of part b? Explain any changes in this value. What does the adjusted R-square for the new equation tell you?The Baker Company wants to develop a budget to predict how overhead costs vary with activity levels. Management is trying to decide whether direct labor hours (DLH) or units produced is the better measure of activity for the firm. Monthly data for the preceding 24 months appear in the file P13_40.xlsx. Use regression analysis to determine which measure, DLH or Units (or both), should be used for the budget. How would the regression equation be used to obtain the budget for the firms overhead costs?A small computer chip manufacturer wants to forecast monthly ozperating costs as a function of the number of units produced during a month. The company has collected the 16 months of data in the file P13_34.xlsx. a. Determine an equation that can be used to predict monthly production costs from units produced. Are there any outliers? b. How could the regression line obtained in part a be used to determine whether the company was efficient or inefficient during any particular month?
- An automobile manufacturer is considering whether to introduce a new model called the Racer. The profitability of the Racer depends on the following factors: The fixed cost of developing the Racer is triangularly distributed with parameters 3, 4, and 5, all in billions. Year 1 sales are normally distributed with mean 200,000 and standard deviation 50,000. Year 2 sales are normally distributed with mean equal to actual year 1 sales and standard deviation 50,000. Year 3 sales are normally distributed with mean equal to actual year 2 sales and standard deviation 50,000. The selling price in year 1 is 25,000. The year 2 selling price will be 1.05[year 1 price + 50 (% diff1)] where % diff1 is the number of percentage points by which actual year 1 sales differ from expected year 1 sales. The 1.05 factor accounts for inflation. For example, if the year 1 sales figure is 180,000, which is 10 percentage points below the expected year 1 sales, then the year 2 price will be 1.05[25,000 + 50( 10)] = 25,725. Similarly, the year 3 price will be 1.05[year 2 price + 50(% diff2)] where % diff2 is the percentage by which actual year 2 sales differ from expected year 2 sales. The variable cost in year 1 is triangularly distributed with parameters 10,000, 12,000, and 15,000, and it is assumed to increase by 5% each year. Your goal is to estimate the NPV of the new car during its first three years. Assume that the company is able to produce exactly as many cars as it can sell. Also, assume that cash flows are discounted at 10%. Simulate 1000 trials to estimate the mean and standard deviation of the NPV for the first three years of sales. Also, determine an interval such that you are 95% certain that the NPV of the Racer during its first three years of operation will be within this interval.The file P13_29.xlsx contains monthly time series data for total U.S. retail sales of building materials (which includes retail sales of building materials, hardware and garden supply stores, and mobile home dealers). a. Is seasonality present in these data? If so, characterize the seasonality pattern. b. Use Winters method to forecast this series with smoothing constants = = 0.1 and = 0.3. Does the forecast series seem to track the seasonal pattern well? What are your forecasts for the next 12 months?An antique collector believes that the price received for a particular item increases with its age and with the number of bidders. The file P13_14.xlsx contains data on these three variables for 32 recently auctioned comparable items. Estimate a multiple regression equation using the given data. Interpret each of the estimated regression coefficients. Is the antique collector correct in believing that the price received for the item increases with its age and with the number of bidders? Interpret the standard error of estimate and the R-square value for these data.
- The file P13_28.xlsx contains monthly retail sales of U.S. liquor stores. a. Is seasonality present in these data? If so, characterize the seasonality pattern. b. Use Winters method to forecast this series with smoothing constants = = 0.1 and = 0.3. Does the forecast series seem to track the seasonal pattern well? What are your forecasts for the next 12 months?A trucking company wants to predict the yearly maintenance expense (Y) for a truck using the number of miles driven during the year (X1) and the age of the truck (X2, in years) at the beginning of the year. The company has gathered the data given in the file P13_13.xlsx. Note that each observation corresponds to a particular truck. Estimate a multiple regression equation using the given data. Interpret each of the estimated regression coefficients. Also, interpret the standard error of estimate and the R-square value for these data.Based on Babich (1992). Suppose that each week each of 300 families buys a gallon of orange juice from company A, B, or C. Let pA denote the probability that a gallon produced by company A is of unsatisfactory quality, and define pB and pC similarly for companies B and C. If the last gallon of juice purchased by a family is satisfactory, the next week they will purchase a gallon of juice from the same company. If the last gallon of juice purchased by a family is not satisfactory, the family will purchase a gallon from a competitor. Consider a week in which A families have purchased juice A, B families have purchased juice B, and C families have purchased juice C. Assume that families that switch brands during a period are allocated to the remaining brands in a manner that is proportional to the current market shares of the other brands. For example, if a customer switches from brand A, there is probability B/(B + C) that he will switch to brand B and probability C/(B + C) that he will switch to brand C. Suppose that the market is currently divided equally: 10,000 families for each of the three brands. a. After a year, what will the market share for each firm be? Assume pA = 0.10, pB = 0.15, and pC = 0.20. (Hint: You will need to use the RISKBINOMLAL function to see how many people switch from A and then use the RISKBENOMIAL function again to see how many switch from A to B and from A to C. However, if your model requires more RISKBINOMIAL functions than the number allowed in the academic version of @RISK, remember that you can instead use the BENOM.INV (or the old CRITBENOM) function to generate binomially distributed random numbers. This takes the form =BINOM.INV (ntrials, psuccess, RAND()).) b. Suppose a 1% increase in market share is worth 10,000 per week to company A. Company A believes that for a cost of 1 million per year it can cut the percentage of unsatisfactory juice cartons in half. Is this worthwhile? (Use the same values of pA, pB, and pC as in part a.)