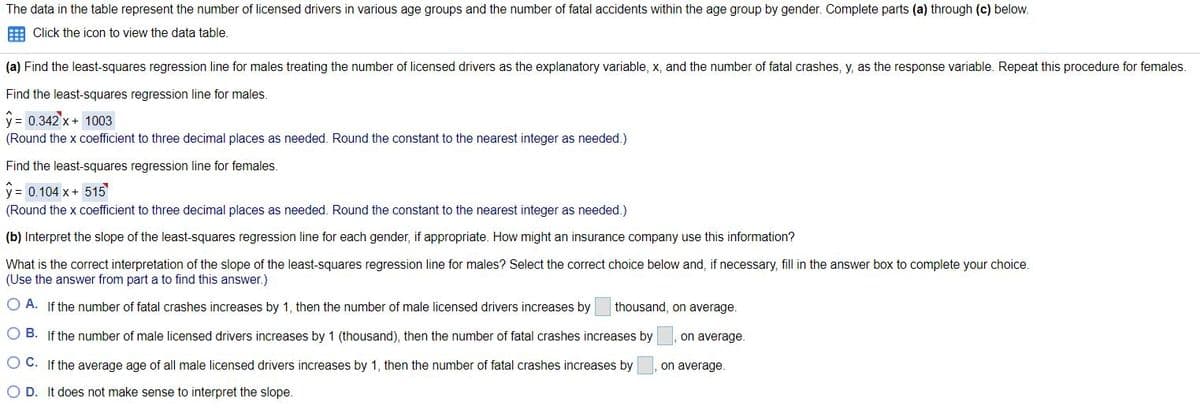
(b) Interpret the slope of the least-squares regression line for each gender, if appropriate. How might an insurance company use this information? What is the correct interpretation of the slope of the least-squares regression line for males? Select the correct choice below and, if necessary, fill in the answer box to complete your choice. (Use the answer from part a to find this answer.) O A. If the number of fatal crashes increases by 1, then the number of male licensed drivers increases by thousand, on average. O B. If the number of male licensed drivers increases by 1 (thousand), then the number of fatal crashes increases by on average. O C. If the average age of all male licensed drivers increases by 1, then the number of fatal crashes increases by on average. O D. It does not make sense to interpret the slope.


Correlation
Correlation defines a relationship between two independent variables. It tells the degree to which variables move in relation to each other. When two sets of data are related to each other, there is a correlation between them.
Linear Correlation
A correlation is used to determine the relationships between numerical and categorical variables. In other words, it is an indicator of how things are connected to one another. The correlation analysis is the study of how variables are related.
Regression Analysis
Regression analysis is a statistical method in which it estimates the relationship between a dependent variable and one or more independent variable. In simple terms dependent variable is called as outcome variable and independent variable is called as predictors. Regression analysis is one of the methods to find the trends in data. The independent variable used in Regression analysis is named Predictor variable. It offers data of an associated dependent variable regarding a particular outcome.


Trending now
This is a popular solution!

Step by step
Solved in 2 steps


