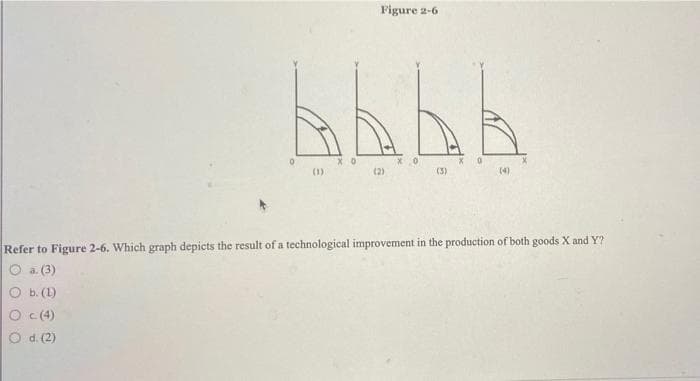
babb (2) (1) Figure 2-6 XO (3) X 0 (4) Refer to Figure 2-6. Which graph depicts the result of a technological improvement in the production of both goods X and Y? a. (3) O b. (1) O c. (4) O d. (2)


Q: Problem 3. (SW 7.10) Show that the two alternative formulas below for the homoscedasticity-only…
A: Homoscedasticity in regression refers to the constant variance of the error term. It is one of the…
Q: In 2012 final sales equal $350 billion and the change in business inventories is -$60 billion. GDP…
A: GDP measures the value of final goods and services that are produced within the borders of the…
Q: 4. Find all correlated equilibria of the "Bach or Stravinsky" game. What is the highest symmetric…
A: Bach or Stravinsky game is a type of coordination game that is also known as the battle of sex. In…
Q: QUESTION 4 A-Marie sells her car for $4,000. She had bought it for $10,000. That transaction…
A: In the above question the income generated from this transaction will be equal to the net profit…
Q: Consider a Cobb-Douglas production function with three inputs. K is capital (the numbe achines), L…
A: Production function shows the relationship between output and inputs. The Marginal product is the…
Q: Lindsey plans to deposit her annual bonus into a savings account that pays 3% interest compounded…
A: formula for the future value is given as: F = P(1+R)t Where P : Present valueF: future valueR :…
Q: For each of the following utility functions, find the Marshallian demand function, the indirect…
A: The factors of spending and commodity price are used to generate the indirect utility function from…
Q: supply occurs when price elasticity of supply is less than 1, and, than 1. [4.5.1 How Much Quantity…
A: Elasticity of supply is the percentage change in quantity supplied due to percentage change in…
Q: In a market with perfect competition, 1. Prices are set by businesses. 2. Businesses confronting an…
A: Theoretically, perfect competition creates a monopoly that enables a business to set any price…
Q: Perform these same calculations for 2018 and 2019, and enter the results in the following table.…
A: CSPI measures the overall price of market basket of goods and services which is fixed throughout the…
Q: A(n) variable is calculated from within the model. A(n) _ endogenous; endogenous O endogenous;…
A: The endogenous variable is the dependent variable while exogenous variables are independent…
Q: Consider a competitive market with a downward sloping demand curve and an upward sloping supply…
A: Given that the market supply curve is upward sloping and the demand curve is downward slopping…
Q: K The cost of a nation's market basket in the base year is $1,200, and the current year's price…
A: Price index measures the overall price level of market basket of goods and services.
Q: Question 4 i. ii. iii. A monopoly can be recognized by certain characteristics that set it aside…
A: We know that A monopoly is when one business holds a dominant position in an industry or area to the…
Q: The price of peanut butter, a complement to jelly, decreases. How will this affect the equilibrium…
A: The demand and supply of any commodity is not onlu affected by its won price but also due to other…
Q: A utility function is given as U = √MB where B represents the quantity of books consumed and M…
A: In economics, the term "utility" describes the overall satisfaction or benefit from consuming a good…
Q: Fiscal policy can affect the rental cost of capital. true or false?
A: Fiscal policy is the use of government spending and taxation by the government to influence the…
Q: Calculate the following values for the permutations and combinations. a. P3 b. P Co C.
A: Prn=n!n-r! where n >= r And Crn = n!r! (n-r)! where n <= r
Q: 2) Given the following supply and demand functions: Supply : Q = 15.90 + 0.72 P G + 0.05 Po Demand :…
A: The equilibrium occurs where the demand and supply are equal. The shortage will occur if supply…
Q: Consider an economy with the Cobb-Douglas production function: Y = 3K0.2L0.8 K = 140000; L=8000…
A: In the study of economics, production functions represents the relationship between the quantity of…
Q: Demand: P=40+i-6Q Supply: P=w+4Q i is income & w is wages Given the supply and demand…
A: The tax revenue-maximizing tax would be a tax on the supply curve of P=w+4Q. The tax would be equal…
Q: QUESTION 9 Compare and contrast the output gap before and after 1980 and select the statement that…
A: As the actual data is not given, so we will answer based on the diagram provided
Q: Economists often say that goods tend to have more elastic demand when they have lots of close x8…
A: In the study of economics, the term utility can be defined as the total satisfaction or benefit that…
Q: The government leaders of Nestua believe that corporations in Nestua are not paying their fair share…
A: Answer to the question is as follows:
Q: Individuals or companies whose needs are far ahead of market trends are referred to as high…
A: Solution: Option-c will be correct i.e. Lead users Explanation: Option-c will be correct. Being far…
Q: J09
A: We know that Great skill entrepreneurs have the power to alter the manner we tend to live and work,…
Q: Massam works for a company that is having a hard time competing in the market. Massam really wants…
A: Massam wants to make his career in marketing. Marketing is all about understanding the consumer…
Q: Question 2: Suppose Tom has following perfect substitute preference. Sketch Ollowing curves (good 1…
A: U(q1 , q2 ) = q1 + 2q2 Above utility function represents perfect substitute preferences in which…
Q: is cheap and requires fewer workers to run. Demonstrate the effect this equipment has on the and for…
A: Equilibrium in the labour market is where demand for labour and supply of labour are equal. This…
Q: For this Short Run firms costs, explain the SHAPE of each curve: MC, ATC and AVC. Where would the…
A: In the short run we assumes that in order to change the output the firm have to adjust its labor…
Q: Ellen is downloading labor market data for the most recent month, but her connection is slow. So far…
A: Given that,Unemployment rate = 5.2%Participation rate = 62.5%Not in labor force = 60 million
Q: If Real GDP in the previous period was $15,840 billion, the economic growth rate is ________% in the…
A: In contrast to the nominal GDP growth rate, the real economic growth rate adjusts for inflation when…
Q: Suppose than an economy has output Y = AK 0.3L 0.7, that Y equals $42 trillion, capital K is $64…
A: Production function: Y = A K0.3 L0.7Y = $42 trillionK = $64 trillionL = 125 million workers
Q: Barriers to entry exist for perfectly competitive firms. restrict the entry of new firms into the…
A:
Q: Consider a perfectly competitive market with 1000 firms. The cost function of each firm is C(q) =…
A: Given Total number of firms = 1000 The cost function of each firm: C(q)=0.025q2+200…
Q: Foreign Direct Investment is viewed by some economic proponents as a great boost to the Balance of…
A: A foreign direct investment (FDI) is a financial investment made by a company or individual from one…
Q: What are the proposal's potential positive and negative externalities?
A: A cost or benefit incurred or received by a producer that is not incurred or received financially by…
Q: The demand and supply schedules in this table list the quantity supplied and quantity demanded of…
A: Demand refers to the quantity that a consumer wishes to buy at a given price in a given period of…
Q: Leaming International Trade - End of Chapter Problem The United States is the fifth largest sugar…
A: Imposition of tariff raises the price paid by consumers for the good. Higher price also increases…
Q: What is scarcity?
A: The term "economics" refers to the scenario in which there are continuous exchanges of a range of…
Q: Why does businesses need to produce safely, on time, to cost; to quality within the law?
A: Production The inputs required to produce a thing or service are known as factors of production,…
Q: Economic activity that is above potential output signals that potential output is about to increase…
A: “Potential output is defined as the maximum amount of goods and services an economy can produce or…
Q: 8. The factor-price equalization theory and transportation costs Which of the following statements…
A: Costs associated with transportation hinder international trade by limiting the transferability of…
Q: Problem 2: You were entitled to receive $5,000 at the end of six months for the rest of your life.…
A: Amount received = 5000 r = 10%
Q: Suppose an economy produces steel, wheat, and oil. The steel industry produces $80,000 in rev- enue,…
A: GDP or Gross Domestic Product is defined as the value of final goods and services, which is bought…
Q: When the price of good Y increases from $2 to $3, the quantity demanded for good X decreases from 20…
A: "Cross-Price elasticity of demand between two commodities indicates how responsive is the demand for…
Q: Required information Assume that 25 years ago your dad invested $380,000, plus $31,000 in years 2…
A: Given that, Interest rate = 11% Investments period of different duration = 25 years Investment…
Q: X Corp would like to borrow from Y Corp. The risk free rate is 6% with current inflation rate of 2%.…
A: Borrowers and lenders are generally concerned about the real rate of lending and borrowing as they…
Q: Adjust the following graph by shifting either the curve or the point on the curve to illustrate a…
A: The Aggregate Demand is key determinant of Income level in the economy. Change in AD causes change…
Q: How much do you have to deposit now(with a second deposit in the amount of $600 at the end of the…
A: Cash flow schedule is given as Year 0 x 1 -600 2 250 3 250 4 250 5 500 6 500…


Trending now
This is a popular solution!

Step by step
Solved in 3 steps


- how to construct: can you explain all parts max┬(v^'∈[0,1]) Pr(b_2<b(v^' ))(v_1-1/2 (b(v^' )+E[b(v_2 )∣v_2<v^' ]))". "A4 can you tell me the conclusion- trends(the pros and cons, the changes throughtout the years increasing and decreasing) in the production of sunflower/sunflower oil, rubber, coffee, sugar cane, potatoes, and grape/vineyards1.Which characteristics a person making handicrafts should acquire to develop marketable products? 2.Why should you apply finishing materals on products? 3.What should you do to achieve a beautiful and attractive product
- 12. A certain production possibilities frontier shows production possibilities for two goods: pants and shirts. Which of the following concepts cannot be illustrated in this model? a. the flow of dollars between (i) sellers of pants and shirts and (ii) buyers of pants and shirts. b. the tradeoff between production of pants and production of shirts. c. the opportunity cost of shirts in terms of pants. d. the effect of economic growth on production possibilities involving pants and shirts.Country JKL has a maximum of 50 labour(hours). The tab shows maximum quantity of wheat and cotton the Country produce with different labour (hours) used. Combination A B C D E F Corn 15 14 12 9 5 0 Wheat 0 2 4 6 8 10 1) Plot the production combinations on a graph paper combinations as A to F. 2) Can Country JKL produce the following A) 4,000 kg of wheat and 9 ,000 kg of cotton B) 14,000 kg of wheat and 6 ,000 kg of cotton 3)Suppose that Country JKL produces 6,000kg of wheat and 100kg of cotton a week.Calculate the opportunity cost it of producing 3,000kg extra cotton a week.Microeconomics - Budget Line (BL) Ethan is a collector of pokemon cards and stickers. He has $56 given by his dad to spend on his collection. The store sells them at $14 per pokemon cards and $7 for the stickers. 1. If Ethan spends all his money on pokemon cards, what is the maximum unit that he can purchase based on the given budget? 2. If Ethan spends all his money on stickers, what is the maximum unit that he can purchase based on the given budget? 3. Show in an illustration where pokemon cards is in the x-axis and y-axis is the sticker.
- Table 3-7Assume that the farmer and the rancher can switch between producing meat and producing potatoes at a constant rate. Labor Hours Needed to Make 1 Pound of Pounds Produced in 24 Hours Meat Potatoes Meat Potatoes Farmer 6 4 4 6 Rancher 3 8 8 3 Refer to Table 3-7. Which of the following combinations of meat and potatoes could the rancher not produce in 24 hours? Group of answer choices 5 pounds of meat and 1 pounds of potatoes. 2 pounds of meat and 2 pounds of potatoes. 1 pounds of meat and 3 pounds of potatoes. 4 pounds of meat and 1 pound of potatoes.PLEASE CHECK THIS HOW TO SOLVE how to construct: can you explain all parts max┬(v^'∈[0,1]) Pr(b_2<b(v^' ))(v_1-1/2 (b(v^' )+E[b(v_2 )∣v_2<v^' ]))". "Need to explain these 3 graphs in own words. ( explain in short )
- Table 13-7The Flying Elvis Copter Rides Quantity TotalCost FixedCost VariableCost MarginalCost AverageFixedCost AverageVariableCost AverageTotalCost 0 $50 $50 $0 -- -- -- -- 1 $150 A B C D E F 2 G H I $120 J K L 3 M N O P Q $120 R Refer to Table 13-7. What is the value of M? a. $50 b. $140 c. $360 d. $4105 2. The following shows different technologies for producing 100 metres of cloth. Technology Number of workers Coal required (tonnes) A 4 2 B 1 6 C 3 7 D 5 5 a) Which technologies would not be chosen by firms? Explain. b) Of the remaining technologies, what determines the technology a firm would choose?4.- What does the economic study consist of?