Based on the density graph below, what is the probability of a value in the sample space being anywhere from 70 to 80? Hint: The distance between consecutive horizontal gridlines is 0.004. 0.06
Based on the density graph below, what is the probability of a value in the sample space being anywhere from 70 to 80? Hint: The distance between consecutive horizontal gridlines is 0.004. 0.06

Mathematics For Machine Technology
8th Edition
ISBN:9781337798310
Author:Peterson, John.
Publisher:Peterson, John.
Chapter29: Tolerance, Clearance, And Interference
Section: Chapter Questions
Problem 16A: Spacers are manufactured to the mean dimension and tolerance shown in Figure 29-12. An inspector...

Related questions
Question
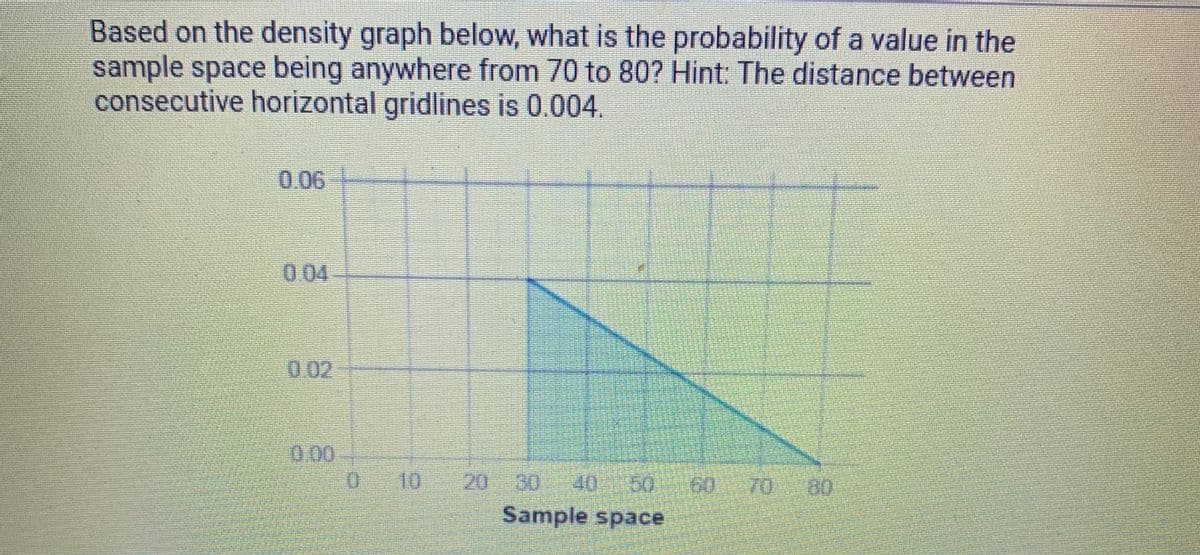
Transcribed Image Text:Based on the density graph below, what is the probability of a value in the
sample space being anywhere from 70 to 80? Hint: The distance between
consecutive horizontal gridlines is 0.004.
0.06
004
0.02
0.00
10
20
30
40
50
70
00
Sample space
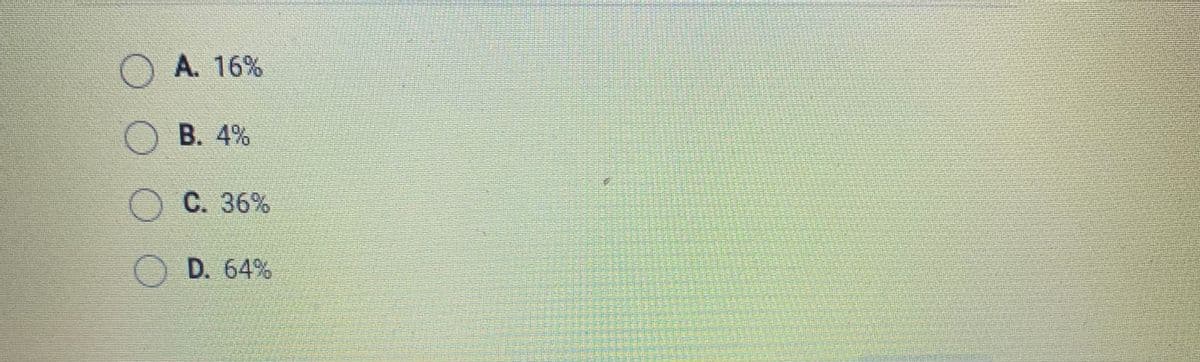
Transcribed Image Text:A. 16%
B. 4%
OC. 36%
O D. 64%
Expert Solution
This question has been solved!
Explore an expertly crafted, step-by-step solution for a thorough understanding of key concepts.

This is a popular solution!

Trending now
This is a popular solution!

Step by step
Solved in 2 steps with 1 images

Recommended textbooks for you
Mathematics For Machine Technology
Advanced Math
ISBN:
9781337798310
Author:
Peterson, John.
Publisher:
Cengage Learning,
Mathematics For Machine Technology
Advanced Math
ISBN:
9781337798310
Author:
Peterson, John.
Publisher:
Cengage Learning,