Basic 11.8 and assemble them for shipping. In order to assess the amount of time his assemblers devote to this task, the retailer takes a random sample of 100 orders and records the number of items in each order (Noltems) and the time needed to assemble the shipment. An online retailer needs to manage the amount of time needed to select the ordered items Time 4.8 14.7 13.7 9.5 2.4 11.8 10.5 12.0 14.3 16.4 17.9 14.5 16.7 20.1 16.8 Noltems 3 3 3 3 3 44 4 44 4 445 Time 20.8 26.8 12.9 13.0 15.4 10.8 20.3 22.3 20.0 21.9 20.7 20.9 19.9 17.1 19.1 NoItems 5 55 5 6 6 Time 6 666 6 7777 17.2 18.1 17.9 12.9 19.6 27.9 22.2 23.2 17.5 15.3 21.8 17.9 20.1 18.9 29.3 Noltems 78 8 8 888 9999 910 10 10 Time 21.5 26.5 28.2 25.1 26.1 28.2 22.3 21.8 25.5 24.4 18.1 26.7 24.6 30.1 21.5 Time 25.2 28.2 22.6 31.3 27.2 28.8 29.7 34.3 27.9 29.7 28.7 34.6 38.0 28.0 37.0 NoItems 17 18 18 18 19 20 21 22 23 24 2525 25 26 27 Time 32.5 39.5 39.0 37.0 35.5 38.3 44.0 39.6 42.3 34.6 44.9 47.4 49.2 45.8 44.0 NoItems 27 30 30 31 37 39 40 41 45 46 Time 46.1 42.9 48.3 46.0 48.2 54.7 49.9 55.4 57.1 52.4 b. Fit a least-squares line to the data, and comment on the degree of fit to the data. c. Fit a regression model with the square root of Noltems as the explanatory variable. d. Which model produced a better fit to the data?
Basic 11.8 and assemble them for shipping. In order to assess the amount of time his assemblers devote to this task, the retailer takes a random sample of 100 orders and records the number of items in each order (Noltems) and the time needed to assemble the shipment. An online retailer needs to manage the amount of time needed to select the ordered items Time 4.8 14.7 13.7 9.5 2.4 11.8 10.5 12.0 14.3 16.4 17.9 14.5 16.7 20.1 16.8 Noltems 3 3 3 3 3 44 4 44 4 445 Time 20.8 26.8 12.9 13.0 15.4 10.8 20.3 22.3 20.0 21.9 20.7 20.9 19.9 17.1 19.1 NoItems 5 55 5 6 6 Time 6 666 6 7777 17.2 18.1 17.9 12.9 19.6 27.9 22.2 23.2 17.5 15.3 21.8 17.9 20.1 18.9 29.3 Noltems 78 8 8 888 9999 910 10 10 Time 21.5 26.5 28.2 25.1 26.1 28.2 22.3 21.8 25.5 24.4 18.1 26.7 24.6 30.1 21.5 Time 25.2 28.2 22.6 31.3 27.2 28.8 29.7 34.3 27.9 29.7 28.7 34.6 38.0 28.0 37.0 NoItems 17 18 18 18 19 20 21 22 23 24 2525 25 26 27 Time 32.5 39.5 39.0 37.0 35.5 38.3 44.0 39.6 42.3 34.6 44.9 47.4 49.2 45.8 44.0 NoItems 27 30 30 31 37 39 40 41 45 46 Time 46.1 42.9 48.3 46.0 48.2 54.7 49.9 55.4 57.1 52.4 b. Fit a least-squares line to the data, and comment on the degree of fit to the data. c. Fit a regression model with the square root of Noltems as the explanatory variable. d. Which model produced a better fit to the data?
Big Ideas Math A Bridge To Success Algebra 1: Student Edition 2015
1st Edition
ISBN:9781680331141
Author:HOUGHTON MIFFLIN HARCOURT
Publisher:HOUGHTON MIFFLIN HARCOURT
Chapter1: Solving Linear Equations
Section1.5: Rewriting Equations And Formula
Problem 49E
Related questions
Question

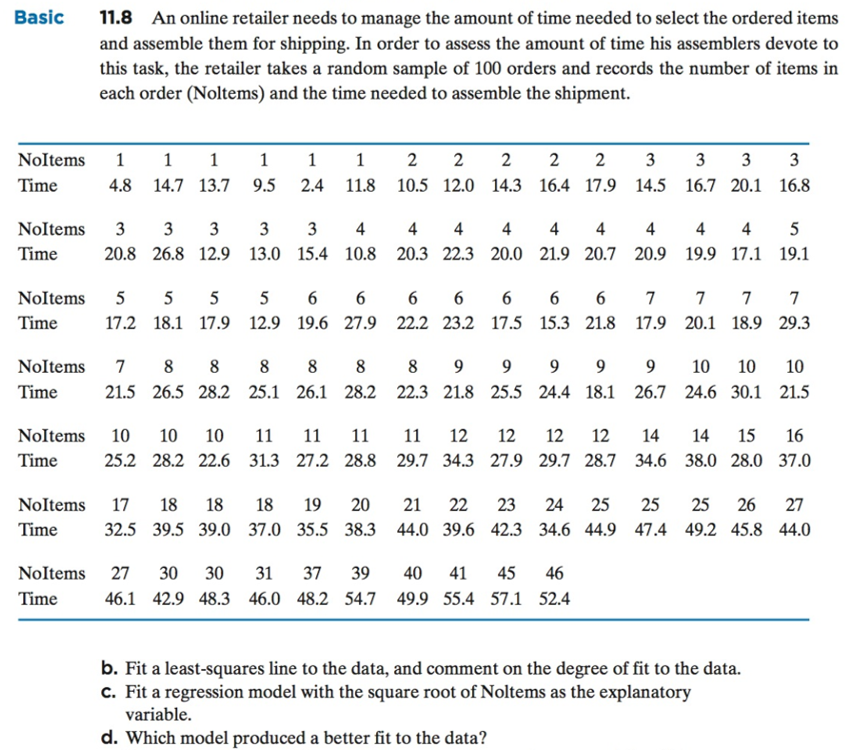
Transcribed Image Text:Basic
11.8
and assemble them for shipping. In order to assess the amount of time his assemblers devote to
this task, the retailer takes a random sample of 100 orders and records the number of items in
each order (Noltems) and the time needed to assemble the shipment.
An online retailer needs to manage the amount of time needed to select the ordered items
Time
4.8 14.7 13.7 9.5 2.4 11.8 10.5 12.0 14.3 16.4 17.9 14.5 16.7 20.1 16.8
Noltems 3 3 3 3 3 44 4 44 4 445
Time
20.8 26.8 12.9 13.0 15.4 10.8 20.3 22.3 20.0 21.9 20.7 20.9 19.9 17.1 19.1
NoItems 5 55 5 6 6
Time
6 666 6 7777
17.2 18.1 17.9 12.9 19.6 27.9 22.2 23.2 17.5 15.3 21.8 17.9 20.1 18.9 29.3
Noltems 78 8 8 888 9999 910 10 10
Time
21.5 26.5 28.2 25.1 26.1 28.2 22.3 21.8 25.5 24.4 18.1 26.7 24.6 30.1 21.5
Time
25.2 28.2 22.6 31.3 27.2 28.8 29.7 34.3 27.9 29.7 28.7 34.6 38.0 28.0 37.0
NoItems 17 18 18 18 19 20 21 22 23 24 2525 25 26 27
Time
32.5 39.5 39.0 37.0 35.5 38.3 44.0 39.6 42.3 34.6 44.9 47.4 49.2 45.8 44.0
NoItems 27 30 30 31 37 39 40 41 45 46
Time
46.1 42.9 48.3 46.0 48.2 54.7 49.9 55.4 57.1 52.4
b. Fit a least-squares line to the data, and comment on the degree of fit to the data.
c. Fit a regression model with the square root of Noltems as the explanatory
variable.
d. Which model produced a better fit to the data?
Expert Solution
This question has been solved!
Explore an expertly crafted, step-by-step solution for a thorough understanding of key concepts.
This is a popular solution!
Trending now
This is a popular solution!
Step by step
Solved in 3 steps with 3 images

Follow-up Questions
Read through expert solutions to related follow-up questions below.
Follow-up Question
I need the step by step of how you got these answers.
Solution
Recommended textbooks for you

Big Ideas Math A Bridge To Success Algebra 1: Stu…
Algebra
ISBN:
9781680331141
Author:
HOUGHTON MIFFLIN HARCOURT
Publisher:
Houghton Mifflin Harcourt

Big Ideas Math A Bridge To Success Algebra 1: Stu…
Algebra
ISBN:
9781680331141
Author:
HOUGHTON MIFFLIN HARCOURT
Publisher:
Houghton Mifflin Harcourt