Before the furniture store began its ad campaign, it averaged 182 customers per day. The manager is investigating if the average has changed since the ad came out. The data for the 11 randomly selected days since the ad campaign began is shown below: 194, 170, 172, 180, 151, 169, 179, 181, 167, 170, 194 Assuming that the distribution is normal, what can be concluded at the a = 0.01 level of significance? a. For this study, we should use Select an answer b. The null and alternative hypotheses would be: Ho: ? v Select an answer v H: ?v Select an answer v c. The test statistic ? v = (please show your answer to 3 decimal places.)
Before the furniture store began its ad campaign, it averaged 182 customers per day. The manager is investigating if the average has changed since the ad came out. The data for the 11 randomly selected days since the ad campaign began is shown below: 194, 170, 172, 180, 151, 169, 179, 181, 167, 170, 194 Assuming that the distribution is normal, what can be concluded at the a = 0.01 level of significance? a. For this study, we should use Select an answer b. The null and alternative hypotheses would be: Ho: ? v Select an answer v H: ?v Select an answer v c. The test statistic ? v = (please show your answer to 3 decimal places.)

Glencoe Algebra 1, Student Edition, 9780079039897, 0079039898, 2018
18th Edition
ISBN:9780079039897
Author:Carter
Publisher:Carter
Chapter10: Statistics
Section10.4: Distributions Of Data
Problem 19PFA

Related questions
Topic Video
Question
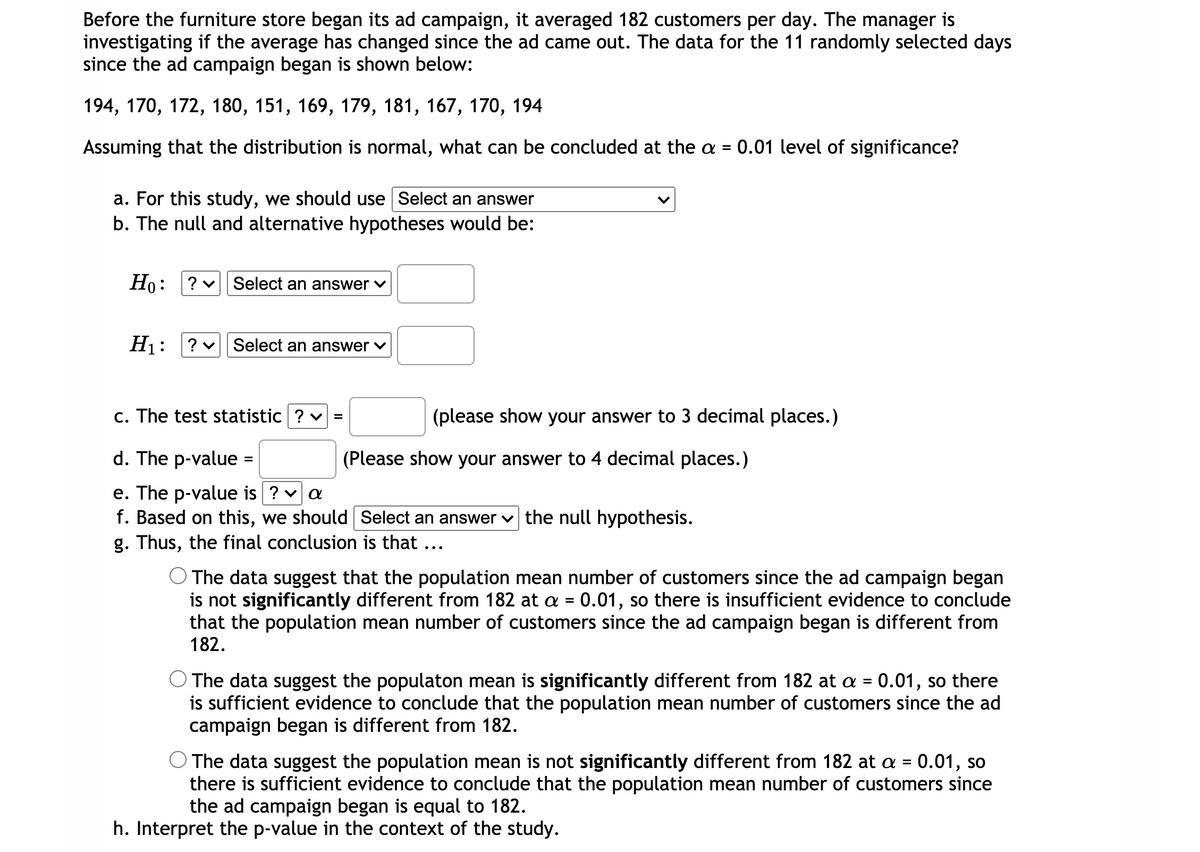
Transcribed Image Text:Before the furniture store began its ad campaign, it averaged 182 customers per day. The manager is
investigating if the average has changed since the ad came out. The data for the 11 randomly selected days
since the ad campaign began is shown below:
194, 170, 172, 180, 151, 169, 179, 181, 167, 170, 194
Assuming that the distribution is normal, what can be concluded at the a = 0.01 level of significance?
%3D
a. For this study, we should use Select an answer
b. The null and alternative hypotheses would be:
Но:
? v Select an answer v
H1:
? v Select an answer ♥
c. The test statistic ? v
(please show your answer to 3 decimal places.)
%3D
d. The p-value =
(Please show your answer to 4 decimal places.)
e. The p-value is ? va
f. Based on this, we should Select an answer
g. Thus, the final conclusion is that ...
the null hypothesis.
O The data suggest that the population mean number of customers since the ad campaign began
is not significantly different from 182 at a = 0.01, so there is insufficient evidence to conclude
that the population mean number of customers since the ad campaign began is different from
182.
O The data suggest the populaton mean is significantly different from 182 at a = 0.01, so there
is sufficient evidence to conclude that the population mean number of customers since the ad
campaign began is different from 182.
O The data suggest the population mean is not significantly different from 182 at a = 0.01, so
there is sufficient evidence to conclude that the population mean number of customers since
the ad campaign began is equal to 182.
%3D
h. Interpret the p-value in the context of the study.
Transcribed Image Text:h. Interpret the p-value in the context of the study.
O If the population mean number of customers since the ad campaign began is 182 and if you
collect data for another 11 days since the ad campaign began, then there would be a
9.78113548% chance that the sample mean for these 11 days would either be less than 175.2 or
greater than 188.8.
There is a 9.78113548% chance that the population mean number of customers since the ad
campaign began is not equal to 182.
O If the population mean number of customers since the ad campaign began is 182 and if you
collect data for another 11 days since the ad campaign began, then there would be a
9.78113548% chance that the population mean would either be less than 175.2 or greater than
188.8.
There is a 9.78113548% chance of a Type I error.
i. Interpret the level of significance in the context of the study.
O If the population mean number of customers since the ad campaign began is different from
182 and if you collect data for another 11 days since the ad campaign began, then there would
be a 1% chance that we would end up falsely concuding that the population mean number of
customers since the ad campaign is equal to 182.
If the population mean number of customers since the ad campaign began is 182 and if you
collect data for another 11 days since the ad campaign began, then there would be a 1%
chance that we would end up falsely concuding that the population mean number of customers
since the ad campaign began is different from 182.
There is a 1% chance that the population mean number of customers since the ad campaign
began is different from 182.
There is a 1% chance that there will be no customers since everyone shops online nowadays.
Expert Solution
This question has been solved!
Explore an expertly crafted, step-by-step solution for a thorough understanding of key concepts.

Step by step
Solved in 2 steps with 3 images

Knowledge Booster


Learn more about
Need a deep-dive on the concept behind this application? Look no further. Learn more about this topic, statistics and related others by exploring similar questions and additional content below.Recommended textbooks for you
Glencoe Algebra 1, Student Edition, 9780079039897…
Algebra
ISBN:
9780079039897
Author:
Carter
Publisher:
McGraw Hill
Glencoe Algebra 1, Student Edition, 9780079039897…
Algebra
ISBN:
9780079039897
Author:
Carter
Publisher:
McGraw Hill