Below is the market for nonfat decaf lattes. Shade total consumer surplus (CS) on the graph by correctly placing the CS shaded area CS S Quantity Price
Below is the market for nonfat decaf lattes. Shade total consumer surplus (CS) on the graph by correctly placing the CS shaded area CS S Quantity Price

Chapter4: Prices: Free, Controlled, And Relative
Section: Chapter Questions
Problem 2WNG

Related questions
Question
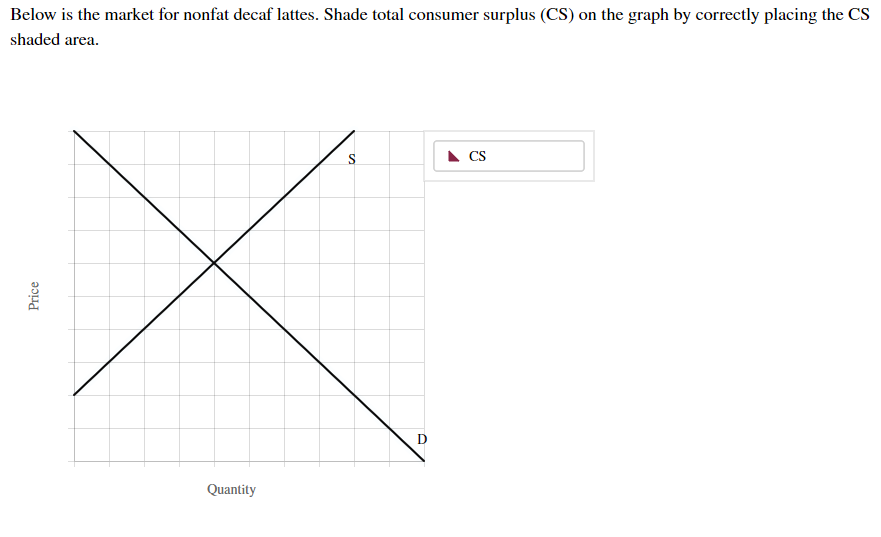
Transcribed Image Text:Below is the market for nonfat decaf lattes. Shade total consumer surplus (CS) on the graph by correctly placing the CS
shaded area
CS
S
Quantity
Price
Expert Solution
This question has been solved!
Explore an expertly crafted, step-by-step solution for a thorough understanding of key concepts.

This is a popular solution!

Trending now
This is a popular solution!

Step by step
Solved in 2 steps with 1 images

Recommended textbooks for you


Economics (MindTap Course List)
Economics
ISBN:
9781337617383
Author:
Roger A. Arnold
Publisher:
Cengage Learning
Economics (MindTap Course List)
Economics
ISBN:
9781337617383
Author:
Roger A. Arnold
Publisher:
Cengage Learning

