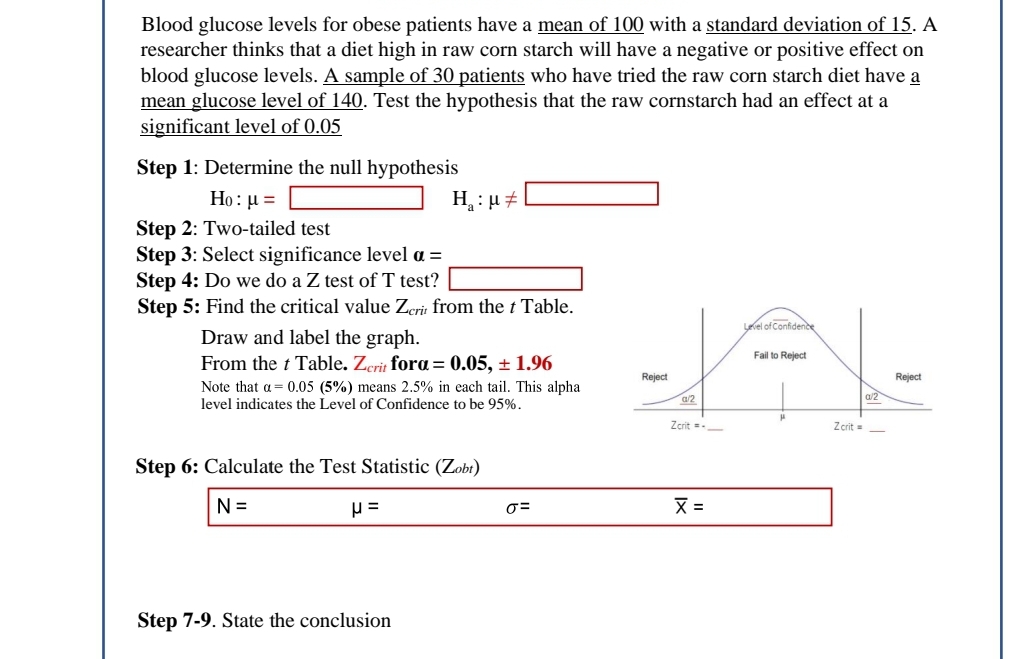
Blood glucose levels for obese patients have a mean of 100 with a standard deviation of 15. A researcher thinks that a diet high in raw corn starch will have a negative or positive effect on blood glucose levels. A sample of 30 patients who have tried the raw corn starch diet have a mean glucose level of 140. Test the hypothesis that the raw cornstarch had an effect at a significant level of 0.05
Blood glucose levels for obese patients have a mean of 100 with a standard deviation of 15. A researcher thinks that a diet high in raw corn starch will have a negative or positive effect on blood glucose levels. A sample of 30 patients who have tried the raw corn starch diet have a mean glucose level of 140. Test the hypothesis that the raw cornstarch had an effect at a significant level of 0.05

MATLAB: An Introduction with Applications
6th Edition
ISBN:9781119256830
Author:Amos Gilat
Publisher:Amos Gilat
Chapter1: Starting With Matlab
Section: Chapter Questions
Problem 1P

Related questions
Question
Blood glucose levels for obese patients have a mean of 100 with a standard deviation of 15. A
researcher thinks that a diet high in raw corn starch will have a negative or positive effect on
blood glucose levels. A sample of 30 patients who have tried the raw corn starch diet have a
mean glucose level of 140. Test the hypothesis that the raw cornstarch had an effect at a
significant level of 0.05
Transcribed Image Text:Blood glucose levels for obese patients have a mean of 100 with a standard deviation of 15. A
researcher thinks that a diet high in raw corn starch will have a negative or positive effect on
blood glucose levels. A sample of 30 patients who have tried the raw corn starch diet have a
mean glucose level of 140. Test the hypothesis that the raw cornstarch had an effect at a
significant level of 0.05
Step 1: Determine the null hypothesis
Ho: µ =
H:u +
Step 2: Two-tailed test
Step 3: Select significance level a =
Step 4: Do we do a Z test of T test?
Step 5: Find the critical value Zeri from the t Table.
Lvel of Confidence
Draw and label the graph.
From the t Table. Zerit fora = 0.05, ± 1.96
Fail to Reject
Reject
Reject
Note that a= 0.05 (5%) means 2.5% in each tail. This alpha
level indicates the Level of Confidence to be 95%.
a/2
a/2
Zcrit =
Zcrit =
Step 6: Calculate the Test Statistic (Zobt)
N =
X =
Step 7-9. State the conclusion
Expert Solution
This question has been solved!
Explore an expertly crafted, step-by-step solution for a thorough understanding of key concepts.

This is a popular solution!

Trending now
This is a popular solution!

Step by step
Solved in 4 steps

Recommended textbooks for you
MATLAB: An Introduction with Applications
Statistics
ISBN:
9781119256830
Author:
Amos Gilat
Publisher:
John Wiley & Sons Inc

Probability and Statistics for Engineering and th…
Statistics
ISBN:
9781305251809
Author:
Jay L. Devore
Publisher:
Cengage Learning

Statistics for The Behavioral Sciences (MindTap C…
Statistics
ISBN:
9781305504912
Author:
Frederick J Gravetter, Larry B. Wallnau
Publisher:
Cengage Learning
MATLAB: An Introduction with Applications
Statistics
ISBN:
9781119256830
Author:
Amos Gilat
Publisher:
John Wiley & Sons Inc
Probability and Statistics for Engineering and th…
Statistics
ISBN:
9781305251809
Author:
Jay L. Devore
Publisher:
Cengage Learning
Statistics for The Behavioral Sciences (MindTap C…
Statistics
ISBN:
9781305504912
Author:
Frederick J Gravetter, Larry B. Wallnau
Publisher:
Cengage Learning

Elementary Statistics: Picturing the World (7th E…
Statistics
ISBN:
9780134683416
Author:
Ron Larson, Betsy Farber
Publisher:
PEARSON

The Basic Practice of Statistics
Statistics
ISBN:
9781319042578
Author:
David S. Moore, William I. Notz, Michael A. Fligner
Publisher:
W. H. Freeman

Introduction to the Practice of Statistics
Statistics
ISBN:
9781319013387
Author:
David S. Moore, George P. McCabe, Bruce A. Craig
Publisher:
W. H. Freeman