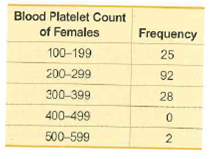
Blood Platelet Count of Females Frequency 100-199 25 200-299 92 300-399 28 400-499 500-599 2.


Q: Construct a frequency distribution for the given data set using 6 classes. In the table, include the…
A:
Q: Practice Task • A final examination given to 47 students resulted to the following grades 26 82 82…
A: Range is a measure of dispersion and is calculated as the difference between the highest and lowest…
Q: Data was collected for fish from the North Atlantic. The length of the fish (in mm) is summarized in…
A: Solution: Frequency distribution: Length (mm) Frequency Class Boundaries 60-63 34 59.5 -63.5…
Q: Construct a frequency distribution, a histogram, frequency polygon and ogive for the data, and…
A: Given data shows the estimated added cost per vehicle use due to bad roads. To construct a frequency…
Q: Construct a frequency distribution for the given data set using 6 classes. In the table, include the…
A: Here given data of amount spent on book for September Amount in dollars Here n = total no. Of…
Q: In Exercises 5–8, identify the class width, class midpoints, and class boundaries for the given…
A: The table shows the frequency distribution for age (years) of best actress when the Oscar was won…
Q: Data was collected for fish from the North Atlantic. The length of the fish (in mm) is summarized in…
A: The class width of a frequency distribution is given by : class width = upper class limit -…
Q: the lower class limits, upper class limits, class width, class midpoints, and class boundaries for…
A:
Q: 3. The average quantitative GRE scores for the top 30 graduate schools of engineering are listed…
A: Here Given data for GRE Score of Top 30 Graduate school of Engineering we will take class Width =10
Q: Data: Student's body weight (kg): 41 60 72 53 72 65 64 48 90 39 38 60 75 48 62 63 49 58 39 72 56 75…
A: For the given data Make frequency distribution table
Q: Below are total home game playing times (hours) for all Major League Baseball teams in a recent…
A: (1.A) Obtain the frequency distribution table. The frequency table is obtained below as follows: The…
Q: Calculate the mean of the data set represent via the distribution below. Class Midpoints Frequency 9…
A: Let us denote, x f 9 11 14 8 19 10 24 5 29 6 34 9 Mean: x f x*f 9 11 99…
Q: a1/ The data shown are the number of grams per serving of 30 selected brands of cakes. Construct a…
A: “Since you have asked multiple questions, we will solve the first question for you. If you want any…
Q: The following frequency distribution presents the weights in pounds (lb) of a sample of visitors to…
A:
Q: Construct a frequency distribution for the given data set using 6 classes. In the table, include the…
A: Given, There is 29 values. Lower value = 50 Upper value = 529
Q: Data was collected for 300 fish from the North Atlantic. The length of the fish (in mm) is…
A:
Q: biologist measured the lengths of hundreds of cuckoo bird eggs. Use the relative frequency…
A: Given that: A frequency in percentage table is given here by using this information we find tha…
Q: Construct a frequency distribution and a relative frequency histogram for the data set using five…
A: Class Interval Frequency Relative frequency 52-58 6 6/24=0.25 59-65 11 11/24=0.4583 66-72 6…
Q: Construct a frequency distribution for the given data set using 6 classes. In the table, include the…
A: The minimum observation is 30. We need 6 classes to summarize the data set. Hence, if we want to use…
Q: Construct a frequency distribution for the given data set using 6 classes. In the table, include the…
A:
Q: data in the following frequency distribution table Classes 50 - 70 - 90 - 110 - | 130 - 150 - 170 fi…
A: Hello! As you have posted more than 3 sub parts, we are answering the first 3 sub-parts. In case…
Q: Solve the attahment.
A: Hey there! Thank you for posting the question.Since you have posted a question with multiple…
Q: .11 During his career in the NHL, hockey great Wayne Gretzky had the following season-total goals…
A: Given Information: Number of goals in 20 seasons are; 51 ,55 ,92 ,71 ,87, 73 ,52 ,62, 40, 54, 40,…
Q: Construct a frequency distribution for the given data set using 6 classes. In the table, include the…
A: We start constructing the class intervals on the basis of the lowest and highest value of the data…
Q: Exercises 1) The following values illustrate the annual incomes among a group of households in a…
A:
Q: Construct a frequency distribution for the given data set using 6 classes. In the table, include the…
A: Frequency distribution: The number of values lying in the particular interval or the number of times…
Q: The calorie counts for the 17 poultry brands are 129 112 102 106 94 101 97 99 141 113 115 132 86 133…
A: 129,112,102,106,94,101,97,99,141,113,115,132,86,133,302,146,134
Q: elow are the scores of 50 students in Statistics Test. Construct a frequency distribution table.…
A: Given: 56 48 47 42 52 58 42 37 68 40 32 46 45 41 38 34 54 57 61 53 26 45 46 44 50 30 40 56 44 39 21…
Q: Organize the ratio level scores below into a simple frequency distribution table. Include columns…
A: Given data is: 49 52 47 52 52 47 49 47 50 51 50 49 50 50 50 53 51 49
Q: Construct a frequency distribution for the given data set using 6 classes. In the table, include the…
A:
Q: Use the frequency distribution to create a histogram with single class values (a bar for 1, a bar…
A: The table shows the frequency distribution.
Q: 2- The ages of the Vice Presidents of the United States at the time of their death are listed below.…
A:
Q: Marks for a university business statistics class are given in the following table. 63 74 42 65 51 54…
A: Since you have posted a question with multiple sub-parts, we will solve first three sub-parts for…
Q: Construct a frequency distribution for the given data set using 6 classes. In the table, include the…
A: Given Total number of observations = 29 To complete the given frequency distribution table.
Q: Construct the cumulative frequency distribution that corresponds to the given frequency…
A: Given Data, Speed Number of cars 0-29 4 30-59 16 60-89 60 90-119 20 Total 100
Q: Construct a histogram, frequency polygon and ogive using frequencies for the distribution of the…
A: Given that The data in class interval And we have to draw histogram , frequency polygon, and Ogive…
Q: In Exercises 50-80, identify the class width, class midpoints, and class boundaries for the given…
A: Given data is Age(yr) of Best Actress When Oscar was won Frequency 20-29 31 30-39 34 40-49…
Q: Construct a frequency distribution for the given data set using 6 classes. In the table, include the…
A:
Q: In Exercises 5–8, identify the class width, class midpoints, and class boundaries for the given…
A: The table shows the frequency distribution for the blood platelet count of males with the…
Q: Construct a frequency distribution and a relative frequency histogram for the accompanying data set…
A: The minimum value in the given data is 138 so the lower limit of the first class will be 138. The…
Q: 5) The data below shows the weight of 36 bags of flour 501 500 502 501 507 496 499 503 499 500 498…
A: To construct frequency distribution table, We arrange the data in ascending order so it would be…
Q: In Exercises 23 and 24, use the given categorical data to construct the relative frequency…
A: Relative Frequency:
Q: The Affordable Care Act created a market place for individuals to purchase health care plans. A…
A: A sample of 36 premiums for the bronze level health insurance are given. N=36 Max=296Min=126…
Q: In Exercises 5–8, identify the class width, class midpoints, and class boundaries for the given…
A: Class width:The class width is the distance between two successive lower limits of class…
Q: Q. Using the data given below answer the questions asked. 56 48 47 42 52 58 42 37 68 40 32 46 45 41…
A: solution is as follows,
Q: The calorie counts for the 17 poultry brands are 129 112 102 106 94 101 97 99 141 113 115 132 86 133…
A: (a) Use EXCEL Procedure to obtain the value of mean. Follow the instruction to obtain the value…
Q: The data set below contains information about the pulse rates of students in a class. Use the data…
A: Here 6 classes are required. To construct the classes, let's find the class width. In the given…
Q: Find the mean of the data summarized in the given frequency distribution table below. Score…
A:
Q: Construct a frequency distribution and a relative frequency histogram for the accompanying data set…
A: A frequency distribution is a representation of data in the tabular, listed or graphical form. It…
In Exercises 5–8, identify the class width, class midpoints, and class boundaries for the given frequency distribution. Also identify the number of individuals included in the summary. The frequency distributions are based on real data from Appendix B.


Trending now
This is a popular solution!

Step by step
Solved in 5 steps with 5 images


- please help me out. show full working out for better understanding Hereditary hemochromatosis (HH) is a recessively inherited genetic disorder resulting from mutations in the HFE gene. There are several possible mutations of different degrees of importance but the disease expresses itself only when at least 2 arepresent in any one individual. A blood analysis was performed on 3,000 blood samples from newborn babies of Caucasian descent in the state of Michigan, USA. The results showed that 163 of those sampled carried two mutations in the HFE gene. a. What is the proportion in the sample that carry the two mutations of the HFE gene? b. Calculate the 95% confidence interval for the proportion of this population that carries two mutations in the HFE Check the data for the necessary conditions and show full working. c. Interpret your interval in context d. If the researcher wanted to halve (x ½) the margin of error in the confidence interval found, what sample size would be required…Determine the kurtosis if the data given is a sample.Demarion Santana is interested in studying the growth rates of capsicum annuum (pepper) plants under bridges in California. He randomly selects 50 bridges in California and records the frequency, height, and number of peppers on any plants growing under these bridges. His results were published in the Almanac of Questionable Statistics, Vol 1 (2016). What is the population in this study? 1. Readers of the Almanac of Questionable Statistics 2. Capsicum annuum plants growing under the 50 bridges randomly selected to be included in the study 3. All capsicum annuum plants growing anywhere in California 4. All capsicum annuum plants growing under bridges in California
- interpret this 2 way anova in detailPostponing Death An interesting and popular hypothesis is that individuals can temporarily postpone death to survive a major holiday or important event such as a birthday. In a study, it was found that there were 6062 deaths in the week before Thanksgiving, and 5938 deaths the week after Thanksgiving (based on data from “Holidays, Birthdays, and Postponement of Cancer Death,” by Young and Hade, Journal of the American Medical Association, Vol. 292, No. 24). If people can postpone death until after Thanksgiving, then the proportion of deaths in the week before should be less than 0.5. Use a 0.05 significance level to test the claim that the proportion of deaths in the week before Thanksgiving is less than 0.5. Based on the result, does there appear to be any indication that people can temporarily postpone death to survive the Thanksgiving holiday?One of the issues facing organizations is increasing diversity throughout an organization. One of the ways to evaluate an organi- zation's success at increasing diversity is to compare the percentage of employees in the organization in a particular position with a specific background to the percentage in a particular position with that specific background in the general workforce. Recently, a large academic medical center determined that 9 of 17 employees in a particular position were female, whereas 55% of the employees for this position in the general workforce were female. At the 0.05 level of significance, is there evidence that the proportion of females in this position at this medical center is different from would be expected in the general workforce?
- Measles is a highly contagious infection of the respiratory system and is caused by a virus. Despite the fact that more than 80% of the world’s population is vaccinated for it, measles remains the fifth leading cause of death worldwide. In general, the term pathogenesis refers to the way a disease originates and develops over time. In the case of measles, the virus enters through the respiratory tract and replicates there before spreading into the bloodstream and then the skin.The measles pathogenesis function used to model the development of the disease is given by the following equation: f (t) = −t (t − 21) (t + 1) Where t is measured in days and f (t) represents the number of infected cells per millilitre [mL] of plasma. What is the peak infection time for the measles virus? Solve the above problem through the following steps: (a)Expand equation f (t) = −t (t − 21) (t + 1) in fully. (b) Calculate the first derivative f′ (t), of the equation found in part (a). (c) Find the…Vertical banded gastroplasty is a surgical procedure that reduces the volume of the stomach in order to produce weight loss. In a recent study, 82 patients with Type 2 diabetes underwent this procedure, and 59 of them experienced a recovery from diabetes. Does this study provide convincing evidence that more than 60% of those with diabetes who undergo this surgery will recover from diabetes? Use a 5% level significance.Measles is a highly contagious infection of the respiratory system and is caused by a virus. Despite the fact that more than 80% of the world’s population is vaccinated for it, measles remains the fifth leading cause of death worldwide. In general, the term pathogenesis refers to the way a disease originates and develops over time. In the case of measles, the virus enters through the respiratory tract and replicates there before spreading into the bloodstream and then the skin. Figure 1: Shown is a transmission electron micrograph of a measles virus. The measles pathogenesis function used to model the development of the disease is given by the following equation: f (t) = −t (t − 21) (t + 1) Where t is measured in days and f (t) represents the number of infected cells per millilitre [mL] of plasma. What is the peak infection time for the measles virus? Solve the above problem through the following steps: (a) Expand equation 2 fully. (b) Calculate the first derivative f′ (t), of the…
- Measles is a highly contagious infection of the respiratory system and is caused by a virus. Despite the fact that more than 80% of the world’s population is vaccinated for it, measles remains the fifth leading cause of death worldwide. In general, the term pathogenesis refers to the way a disease originates and develops over time. In the case of measles, the virus enters through the respiratory tract and replicates there before spreading into the bloodstream and then the skin.Figure 1: Shown is a transmission electron micrograph of a measles virus.1The measles pathogenesis function used to model the development of the disease is given by the following equation: f (t) = −t(t − 21)(t + 1) (2)where t is measured in days and f (t) represents the number of infected cells per milliliter [mL] of plasma. What is the peak infection time for the measles virus? Solve the above problem through the following steps:(a) Expand equation 2 fully. [1] (b) Calculate the first derivative f′ (t), of the…Water availability is of prime importance in the life cycle of most reptiles. To determine the rate of evaporative water loss of a certain species of lizard at a particular desert site, 34 such lizards were randomly collected, weighed and placed under the appropriate experimental conditions. After 24 hours, each lizard was removed, weighed, and its total water loss was calculated by subtracting its body weight after treatment from its initial body weight. Previous studies have shown that the relative frequency distribution of water loss for this species of lizard has a mean of 3.1 grams and a s.d. of 0.8 gram b) What is the probability that x is less than 2.7 grams?Water availability is of prime importance in the life cycle of most reptiles. To determine the rate of evaporative water loss of a certain species of lizard at a particular desert site, 34 such lizards were randomly collected, weighed and placed under the appropriate experimental conditions. After 24 hours, each lizard was removed, weighed, and its total water loss was calculated by subtracting its body weight after treatment from its initial body weight. Previous studies have shown that the relative frequency distribution of water loss for this species of lizard has a mean of 3.1 grams and a s.d. of 0.8 gram. a) What is the approximate sampling distribution of x , the mean water loss of the 34 lizards


