Bonus Assignment - Worth 5 Exam Points Principles of Macroeconomics ECO 2301 Dr. Frank Assignment Due: Sunday at midnight! Enter your answer in the "test" link that will be avalible in Blackboard under "Exam 2 Handouts." Table 1 provides the consumer price index values for every year since 1931 (taken from www.bls.gov). Table 2 shows U.S. box office receipts for the top 275 all-time grossing movies (in millions of $s) The dollar value listed for each movie is the nominal value. Using this information, search the nominal list of 275 movies and create a new list of the all-time top 5 grossing movies ranked in real dollars terms. Express these real values in terms of 2019 dollars. You will need to turn in via a Blackboard "test" only the movie names and the real dollar values for each. (Note: for simplicity, we are assuming the gross box office receipt value occurred entirely in the year of release.) Table 1 Consumer Price Index CPI Year Year CPI CPI CPI Year Year 1979 72.6 26.8 1955 2003 184 15.2 1931 1980 82.4 27.2 1956 2004 188.9 13.6 1932 1981 90.9 28.1 1957 2005 195.3 12.9 1933 1982 28.9 96.5 201.6 1958 2006 13.4 1934 1983 207.3 29.2 1959 99.6 2007 13.7 1935 1984 29.6 103.9 215.3 1960 2008 13.9 1936 1985 107.6 214.5 1961 29.9 2009 14.4 1937 1986 109.6 218.1 30.3 1962 2010 14.1 1938 224.9 113.6 1987 1963 30.6 2011 13.9 1939 229.6 31 1988 118.3 1964 2012 14 1940 233 31.5 1989 1965 124 2013 14.7 1941 236.7 32.5 1990 130.7 1966 2014 16.3 1942 1967 1991 136.2 2015 237 33.4 17.3 1943 2016 1992 140.3 240 17.6 34.8 1968 1944 144.5 1993 2017 245.1 1969 18 36.7 1945 1994 148.2 1970 2018 250.5 19.5 38.8 1946 1971 1995 152.4 40.5 2019 256.6 22.3 1947 1996 1972 41.8 156.9 24 1948 1997 1998 1973 44.4 160.5 23.8 1949 1974 49.3 163 24.1 1950 1975 1999 53.8 166.6 26 1951 1976 2000 56.9 172.2 26.6 1952 60.6 1977 2001 177.1 26.8 1953 1978 65.2 2002 179.9 26.9 1954 Table 2 Top 275 All Time Highest Grossing Movies (U.S.) Rank Movie 1 Star Wars: The Force Awakens 2 Avengers: Endgame 3Avatar 4 Black Panther 5 Avengers: Infinity War 6 Titanic 7 Jurassic World 8 Marvel's The Avengers 9 Star Wars: The Last Jedi 10 Incredibles 2 11 The Dark Knight 12 The Lion King (2019) 13 Rogue One: A Star Wars Story 14 Beauty and the Beast (2017) 15 Finding Dory 16 Star Wars: Episode I The Phantom Menace 17 Star Wars 18 Avengers: Age of Ultron 19 The Dark Knight Rises 20 Shrek 2 21 E.T: The Extra-Terrestrial 22 Toy Story 4 23 Captain Marvel 24 The Hunger Games: Catching Fire 25 Pirates of the Caribbean: Dead Man's Chest 26 The Lion King 27 Jurassic World: Fallen Kingdom 28 Toy Story 3 29 Wonder Woman Year 2015 Nominal $ $936,662,225 $858,373,000 $760,507,625 $700,059,566 $678,815,482 $659,363,944 $652,270,625 $623,357,910 $620,181,382 $608,581,744 $535,234,033 $534,830,025 $532,177,324 $504,014,165 $486,295,561 $474,544,677 $460,998,007 $459,005,868 $448,139,099 $441,226,247 $435,110,554 $432,442,023 $426,829,839 $424,668,047 $423,315,812 $422,783,777 $417,719,760 $415,004,880 $412,563,408 $409,013,994 $408,084,349 $408,010,692 $404,564,861 $403,706,375 $402,828,120 $402,111,870 $400,738,009 $389,813,101 $389,344,768 $381,193,157 $380,843,261 $380,270,577 $377,845,905 $373,585,825 $370,782,930 $368,384,330 $368,061,265 $364,001,123 $363,070,709 $356,461,711 $355,116,622 $353,007,020 $352,390,543 $350,126,372 $342,551,365 $341,268,248 $337,135,885 $336,530,303 $336,045,770 $335,061,807 $334,201,140 $334,191,110 $333,176,600 2019 2009 2018 2018 1997 2015 2012 2017 2018 2008 2019 2016 2017 2016 1999 1977 2015 2012 2004 1982 2019 2019 2013 2006 1994 2018 2010 2017 30 Iron Man 3 31 Captain America: Civil War 32 The Hunger Games 33 Jumanji: Welcome to the Jungle 34 Spider-Man 35 Jurassic Park 36 Transformers: Revenge of the Fallen 37 Frozen 38 Guardians of the Galaxy Vol. 2 39 Spider-Man: Far from Home 40 Harry Potter and the Deathly Hallows Part 2 41 Finding Nemo 42 Star Wars: Episode ll - Revenge of the Sith 43 The Lord of the Rings: The Return of the King 44 Spider-Man 2 45 The Passion of the Christ 46 The Secret Life of Pets 47 Despicable Me 2 48 The Jungle Book (2016) 49 Deadpool 50 Inside Out 51 Aladdin (2019) 52 Furious 7 53 Transformers: Dark of the Moon 54 American Sniper 55 The Lord of the Rings: The Two Towers 56 Zootopia 57 The Hunger Games: Mockingjay - Part 1 58 Spider-Man 3 59 Minions 60 Aquaman 61 Spider-Man: Homecoming 62 Alice in Wonderland (2010) 63 Guardians of the Galaxy 2013 2016 2012 2017 2002 1993 2009 2013 2017 2019 2011 2003 2005 2003 2004 2004 2016 2013 2016 2016 2015 2019 2015 2011 2014 2002 2016 2014 2007 2015 2018 2017 2010 2014
Bonus Assignment - Worth 5 Exam Points Principles of Macroeconomics ECO 2301 Dr. Frank Assignment Due: Sunday at midnight! Enter your answer in the "test" link that will be avalible in Blackboard under "Exam 2 Handouts." Table 1 provides the consumer price index values for every year since 1931 (taken from www.bls.gov). Table 2 shows U.S. box office receipts for the top 275 all-time grossing movies (in millions of $s) The dollar value listed for each movie is the nominal value. Using this information, search the nominal list of 275 movies and create a new list of the all-time top 5 grossing movies ranked in real dollars terms. Express these real values in terms of 2019 dollars. You will need to turn in via a Blackboard "test" only the movie names and the real dollar values for each. (Note: for simplicity, we are assuming the gross box office receipt value occurred entirely in the year of release.) Table 1 Consumer Price Index CPI Year Year CPI CPI CPI Year Year 1979 72.6 26.8 1955 2003 184 15.2 1931 1980 82.4 27.2 1956 2004 188.9 13.6 1932 1981 90.9 28.1 1957 2005 195.3 12.9 1933 1982 28.9 96.5 201.6 1958 2006 13.4 1934 1983 207.3 29.2 1959 99.6 2007 13.7 1935 1984 29.6 103.9 215.3 1960 2008 13.9 1936 1985 107.6 214.5 1961 29.9 2009 14.4 1937 1986 109.6 218.1 30.3 1962 2010 14.1 1938 224.9 113.6 1987 1963 30.6 2011 13.9 1939 229.6 31 1988 118.3 1964 2012 14 1940 233 31.5 1989 1965 124 2013 14.7 1941 236.7 32.5 1990 130.7 1966 2014 16.3 1942 1967 1991 136.2 2015 237 33.4 17.3 1943 2016 1992 140.3 240 17.6 34.8 1968 1944 144.5 1993 2017 245.1 1969 18 36.7 1945 1994 148.2 1970 2018 250.5 19.5 38.8 1946 1971 1995 152.4 40.5 2019 256.6 22.3 1947 1996 1972 41.8 156.9 24 1948 1997 1998 1973 44.4 160.5 23.8 1949 1974 49.3 163 24.1 1950 1975 1999 53.8 166.6 26 1951 1976 2000 56.9 172.2 26.6 1952 60.6 1977 2001 177.1 26.8 1953 1978 65.2 2002 179.9 26.9 1954 Table 2 Top 275 All Time Highest Grossing Movies (U.S.) Rank Movie 1 Star Wars: The Force Awakens 2 Avengers: Endgame 3Avatar 4 Black Panther 5 Avengers: Infinity War 6 Titanic 7 Jurassic World 8 Marvel's The Avengers 9 Star Wars: The Last Jedi 10 Incredibles 2 11 The Dark Knight 12 The Lion King (2019) 13 Rogue One: A Star Wars Story 14 Beauty and the Beast (2017) 15 Finding Dory 16 Star Wars: Episode I The Phantom Menace 17 Star Wars 18 Avengers: Age of Ultron 19 The Dark Knight Rises 20 Shrek 2 21 E.T: The Extra-Terrestrial 22 Toy Story 4 23 Captain Marvel 24 The Hunger Games: Catching Fire 25 Pirates of the Caribbean: Dead Man's Chest 26 The Lion King 27 Jurassic World: Fallen Kingdom 28 Toy Story 3 29 Wonder Woman Year 2015 Nominal $ $936,662,225 $858,373,000 $760,507,625 $700,059,566 $678,815,482 $659,363,944 $652,270,625 $623,357,910 $620,181,382 $608,581,744 $535,234,033 $534,830,025 $532,177,324 $504,014,165 $486,295,561 $474,544,677 $460,998,007 $459,005,868 $448,139,099 $441,226,247 $435,110,554 $432,442,023 $426,829,839 $424,668,047 $423,315,812 $422,783,777 $417,719,760 $415,004,880 $412,563,408 $409,013,994 $408,084,349 $408,010,692 $404,564,861 $403,706,375 $402,828,120 $402,111,870 $400,738,009 $389,813,101 $389,344,768 $381,193,157 $380,843,261 $380,270,577 $377,845,905 $373,585,825 $370,782,930 $368,384,330 $368,061,265 $364,001,123 $363,070,709 $356,461,711 $355,116,622 $353,007,020 $352,390,543 $350,126,372 $342,551,365 $341,268,248 $337,135,885 $336,530,303 $336,045,770 $335,061,807 $334,201,140 $334,191,110 $333,176,600 2019 2009 2018 2018 1997 2015 2012 2017 2018 2008 2019 2016 2017 2016 1999 1977 2015 2012 2004 1982 2019 2019 2013 2006 1994 2018 2010 2017 30 Iron Man 3 31 Captain America: Civil War 32 The Hunger Games 33 Jumanji: Welcome to the Jungle 34 Spider-Man 35 Jurassic Park 36 Transformers: Revenge of the Fallen 37 Frozen 38 Guardians of the Galaxy Vol. 2 39 Spider-Man: Far from Home 40 Harry Potter and the Deathly Hallows Part 2 41 Finding Nemo 42 Star Wars: Episode ll - Revenge of the Sith 43 The Lord of the Rings: The Return of the King 44 Spider-Man 2 45 The Passion of the Christ 46 The Secret Life of Pets 47 Despicable Me 2 48 The Jungle Book (2016) 49 Deadpool 50 Inside Out 51 Aladdin (2019) 52 Furious 7 53 Transformers: Dark of the Moon 54 American Sniper 55 The Lord of the Rings: The Two Towers 56 Zootopia 57 The Hunger Games: Mockingjay - Part 1 58 Spider-Man 3 59 Minions 60 Aquaman 61 Spider-Man: Homecoming 62 Alice in Wonderland (2010) 63 Guardians of the Galaxy 2013 2016 2012 2017 2002 1993 2009 2013 2017 2019 2011 2003 2005 2003 2004 2004 2016 2013 2016 2016 2015 2019 2015 2011 2014 2002 2016 2014 2007 2015 2018 2017 2010 2014

Chapter2: Using Economics To Study Health Issues
Section: Chapter Questions
Problem 4QAP

Related questions
Question
What formulas do I use to get all the movies ranked by real dollars terms (2019 dollars)?
Transcribed Image Text:Bonus Assignment - Worth 5 Exam Points
Principles of Macroeconomics ECO 2301 Dr. Frank
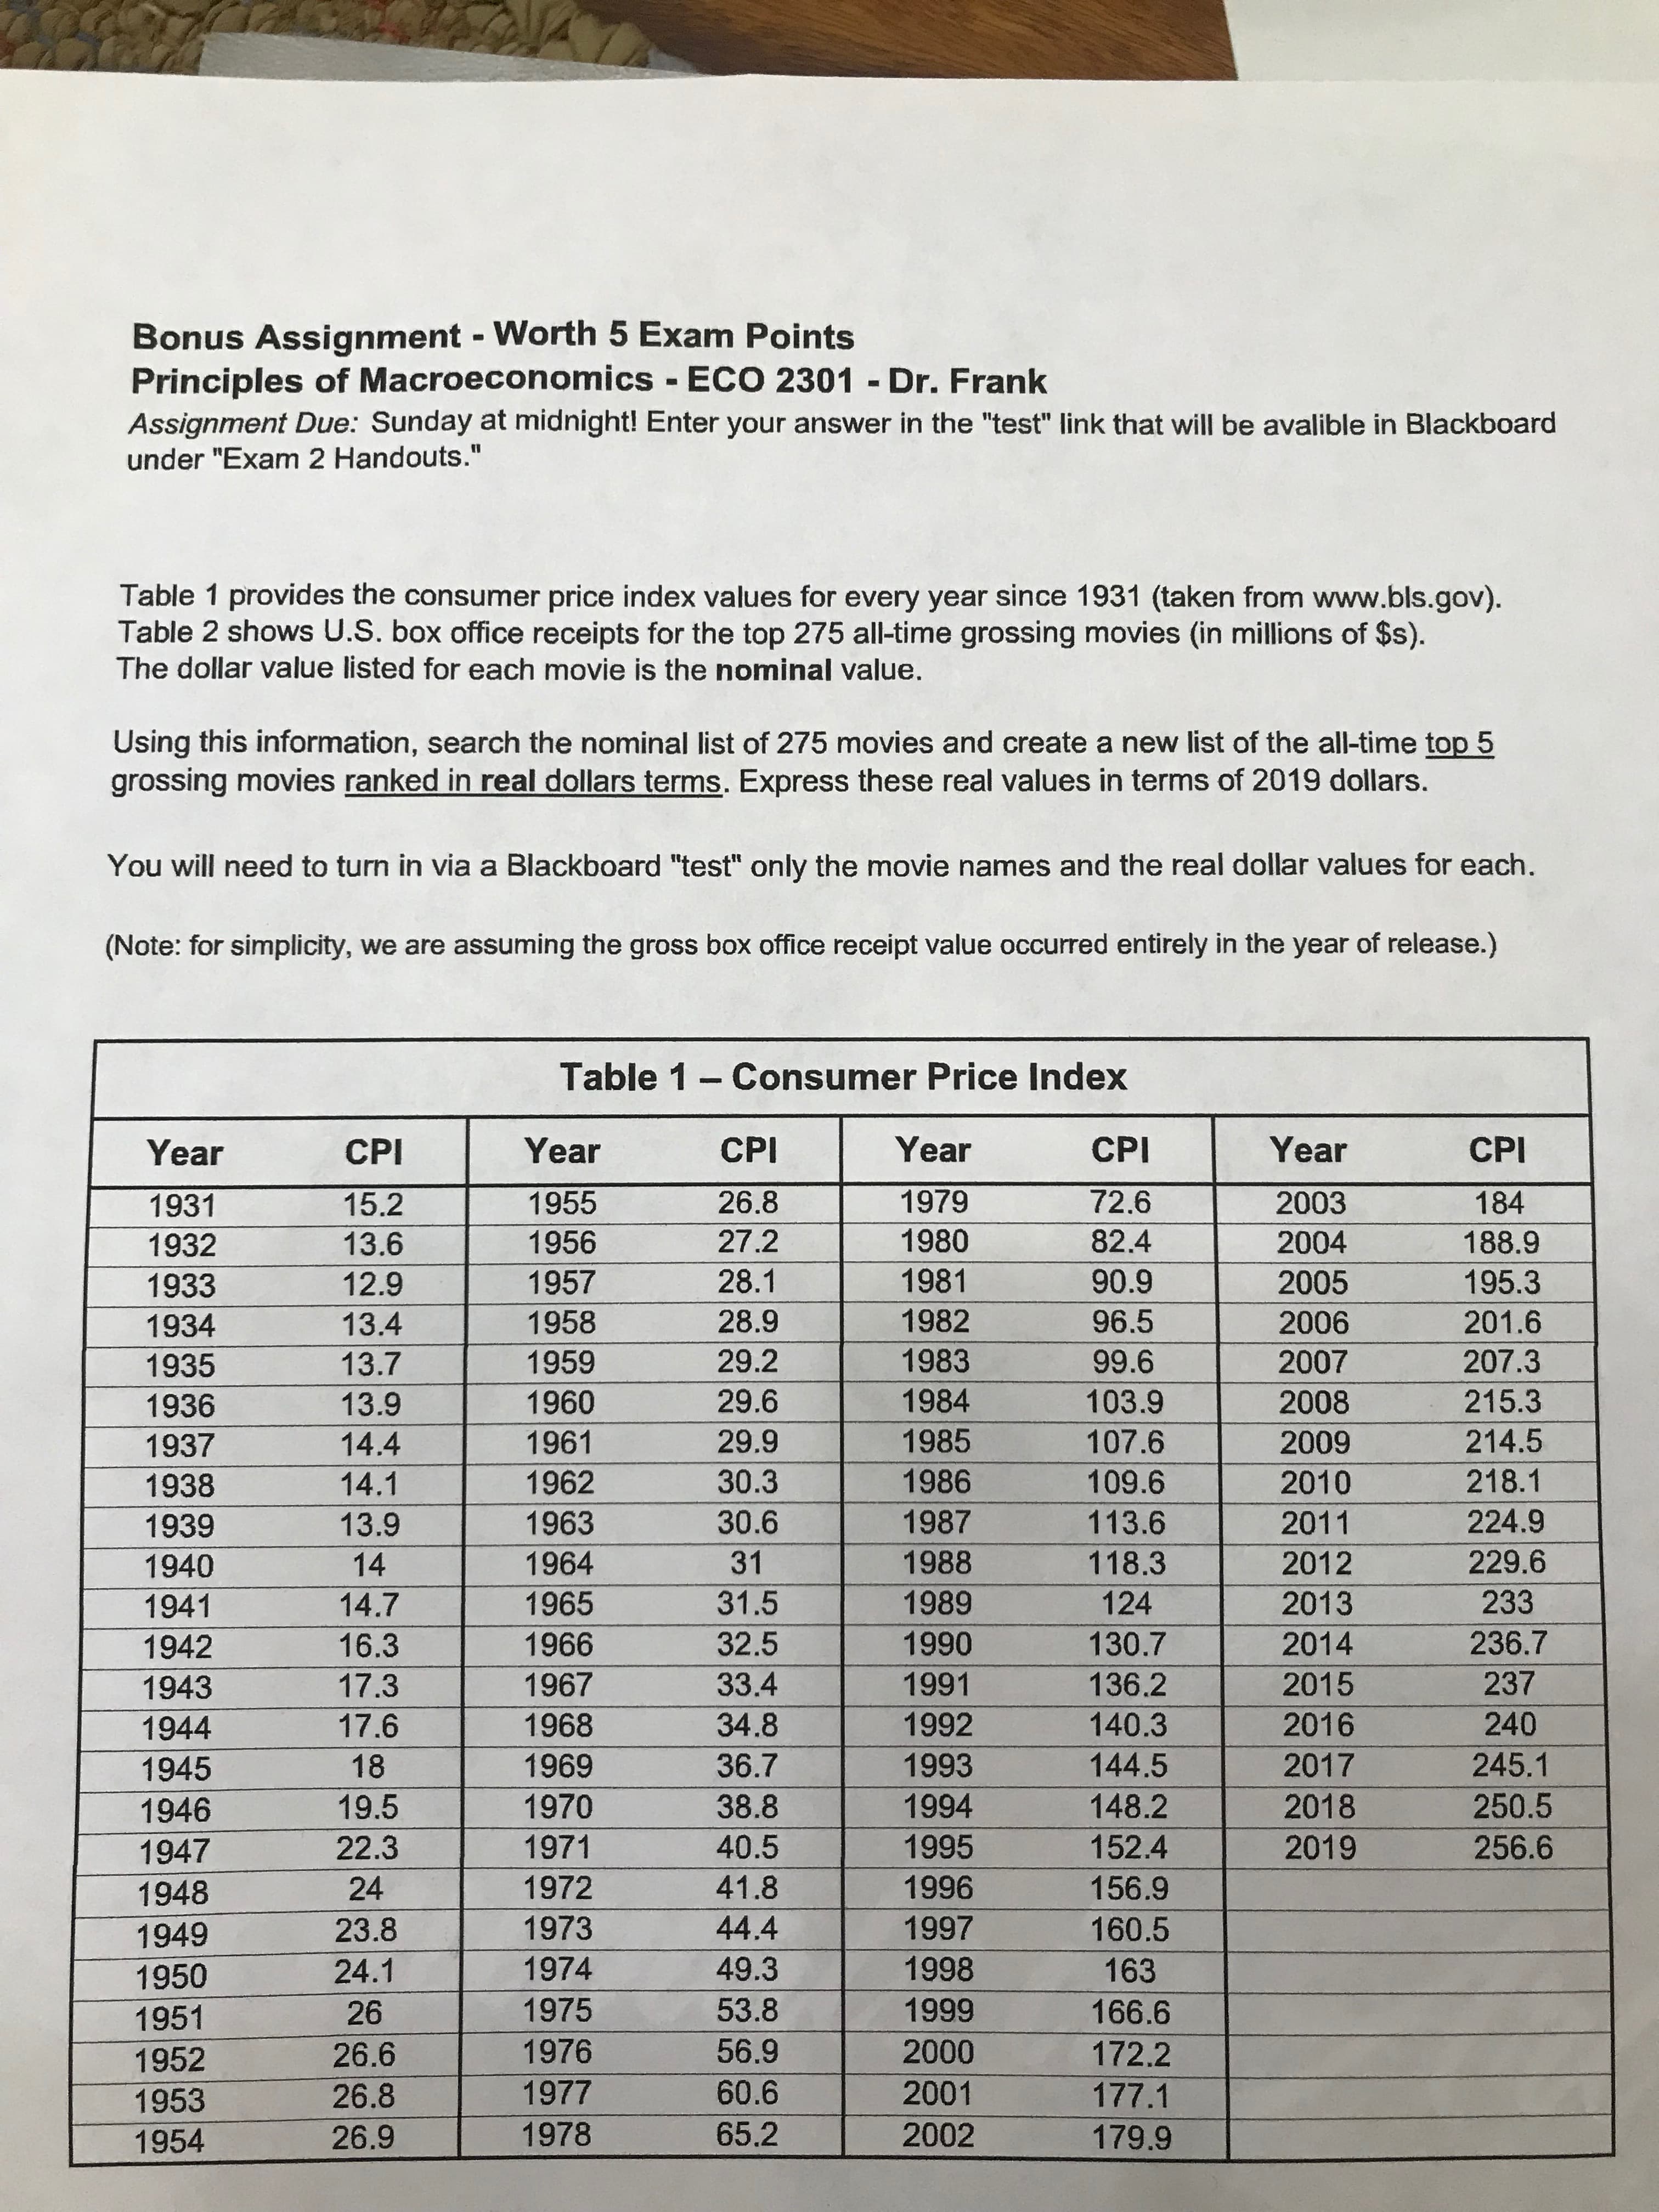
Assignment Due: Sunday at midnight! Enter your answer in the "test" link that will be avalible in Blackboard
under "Exam 2 Handouts."
Table 1 provides the consumer price index values for every year since 1931 (taken from www.bls.gov).
Table 2 shows U.S. box office receipts for the top 275 all-time grossing movies (in millions of $s)
The dollar value listed for each movie is the nominal value.
Using this information, search the nominal list of 275 movies and create a new list of the all-time top 5
grossing movies ranked in real dollars terms. Express these real values in terms of 2019 dollars.
You will need to turn in via a Blackboard "test" only the movie names and the real dollar values for each.
(Note: for simplicity, we are assuming the gross box office receipt value occurred entirely in the year of release.)
Table 1 Consumer Price Index
CPI
Year
Year
CPI
CPI
CPI
Year
Year
1979
72.6
26.8
1955
2003
184
15.2
1931
1980
82.4
27.2
1956
2004
188.9
13.6
1932
1981
90.9
28.1
1957
2005
195.3
12.9
1933
1982
28.9
96.5
201.6
1958
2006
13.4
1934
1983
207.3
29.2
1959
99.6
2007
13.7
1935
1984
29.6
103.9
215.3
1960
2008
13.9
1936
1985
107.6
214.5
1961
29.9
2009
14.4
1937
1986
109.6
218.1
30.3
1962
2010
14.1
1938
224.9
113.6
1987
1963
30.6
2011
13.9
1939
229.6
31
1988
118.3
1964
2012
14
1940
233
31.5
1989
1965
124
2013
14.7
1941
236.7
32.5
1990
130.7
1966
2014
16.3
1942
1967
1991
136.2
2015
237
33.4
17.3
1943
2016
1992
140.3
240
17.6
34.8
1968
1944
144.5
1993
2017
245.1
1969
18
36.7
1945
1994
148.2
1970
2018
250.5
19.5
38.8
1946
1971
1995
152.4
40.5
2019
256.6
22.3
1947
1996
1972
41.8
156.9
24
1948
1997
1998
1973
44.4
160.5
23.8
1949
1974
49.3
163
24.1
1950
1975
1999
53.8
166.6
26
1951
1976
2000
56.9
172.2
26.6
1952
60.6
1977
2001
177.1
26.8
1953
1978
65.2
2002
179.9
26.9
1954
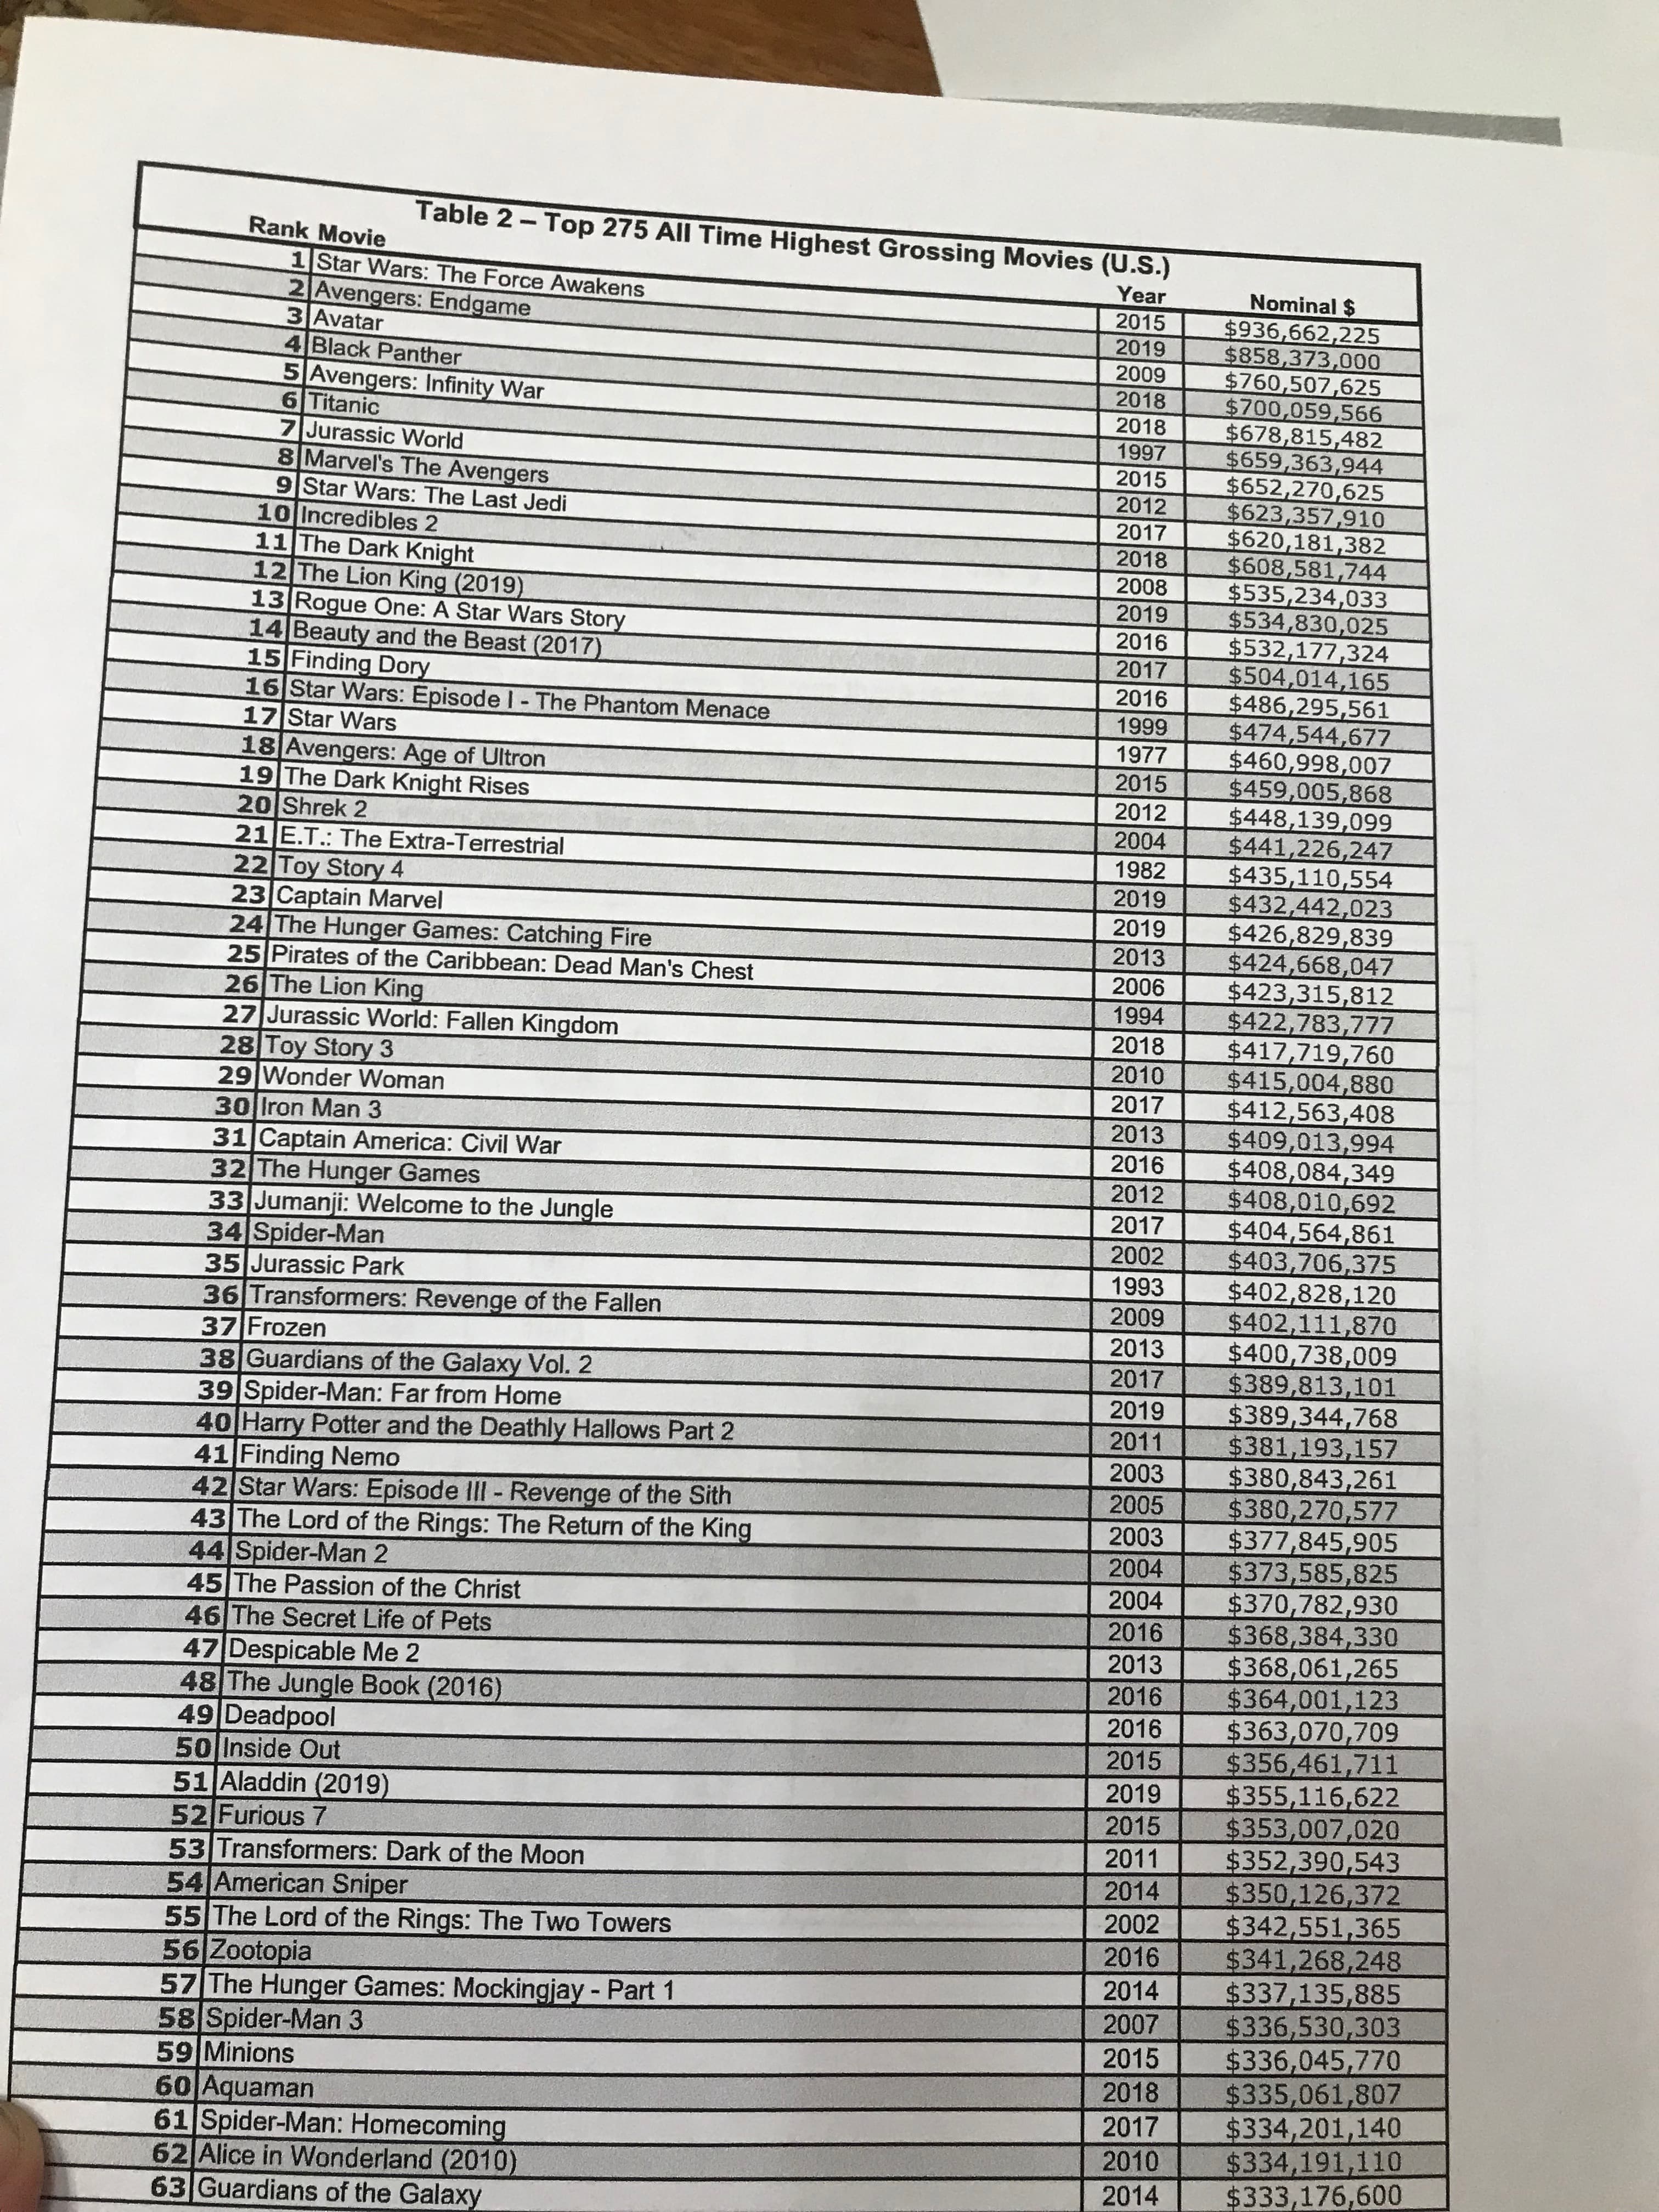
Transcribed Image Text:Table 2 Top 275 All Time Highest Grossing Movies (U.S.)
Rank Movie
1 Star Wars: The Force Awakens
2 Avengers: Endgame
3Avatar
4 Black Panther
5 Avengers: Infinity War
6 Titanic
7 Jurassic World
8 Marvel's The Avengers
9 Star Wars: The Last Jedi
10 Incredibles 2
11 The Dark Knight
12 The Lion King (2019)
13 Rogue One: A Star Wars Story
14 Beauty and the Beast (2017)
15 Finding Dory
16 Star Wars: Episode I The Phantom Menace
17 Star Wars
18 Avengers: Age of Ultron
19 The Dark Knight Rises
20 Shrek 2
21 E.T: The Extra-Terrestrial
22 Toy Story 4
23 Captain Marvel
24 The Hunger Games: Catching Fire
25 Pirates of the Caribbean: Dead Man's Chest
26 The Lion King
27 Jurassic World: Fallen Kingdom
28 Toy Story 3
29 Wonder Woman
Year
2015
Nominal $
$936,662,225
$858,373,000
$760,507,625
$700,059,566
$678,815,482
$659,363,944
$652,270,625
$623,357,910
$620,181,382
$608,581,744
$535,234,033
$534,830,025
$532,177,324
$504,014,165
$486,295,561
$474,544,677
$460,998,007
$459,005,868
$448,139,099
$441,226,247
$435,110,554
$432,442,023
$426,829,839
$424,668,047
$423,315,812
$422,783,777
$417,719,760
$415,004,880
$412,563,408
$409,013,994
$408,084,349
$408,010,692
$404,564,861
$403,706,375
$402,828,120
$402,111,870
$400,738,009
$389,813,101
$389,344,768
$381,193,157
$380,843,261
$380,270,577
$377,845,905
$373,585,825
$370,782,930
$368,384,330
$368,061,265
$364,001,123
$363,070,709
$356,461,711
$355,116,622
$353,007,020
$352,390,543
$350,126,372
$342,551,365
$341,268,248
$337,135,885
$336,530,303
$336,045,770
$335,061,807
$334,201,140
$334,191,110
$333,176,600
2019
2009
2018
2018
1997
2015
2012
2017
2018
2008
2019
2016
2017
2016
1999
1977
2015
2012
2004
1982
2019
2019
2013
2006
1994
2018
2010
2017
30 Iron Man 3
31 Captain America: Civil War
32 The Hunger Games
33 Jumanji: Welcome to the Jungle
34 Spider-Man
35 Jurassic Park
36 Transformers: Revenge of the Fallen
37 Frozen
38 Guardians of the Galaxy Vol. 2
39 Spider-Man: Far from Home
40 Harry Potter and the Deathly Hallows Part 2
41 Finding Nemo
42 Star Wars: Episode ll - Revenge of the Sith
43 The Lord of the Rings: The Return of the King
44 Spider-Man 2
45 The Passion of the Christ
46 The Secret Life of Pets
47 Despicable Me 2
48 The Jungle Book (2016)
49 Deadpool
50 Inside Out
51 Aladdin (2019)
52 Furious 7
53 Transformers: Dark of the Moon
54 American Sniper
55 The Lord of the Rings: The Two Towers
56 Zootopia
57 The Hunger Games: Mockingjay - Part 1
58 Spider-Man 3
59 Minions
60 Aquaman
61 Spider-Man: Homecoming
62 Alice in Wonderland (2010)
63 Guardians of the Galaxy
2013
2016
2012
2017
2002
1993
2009
2013
2017
2019
2011
2003
2005
2003
2004
2004
2016
2013
2016
2016
2015
2019
2015
2011
2014
2002
2016
2014
2007
2015
2018
2017
2010
2014
Expert Solution
This question has been solved!
Explore an expertly crafted, step-by-step solution for a thorough understanding of key concepts.

This is a popular solution!

Trending now
This is a popular solution!

Step by step
Solved in 3 steps with 1 images

Knowledge Booster


Learn more about
Need a deep-dive on the concept behind this application? Look no further. Learn more about this topic, economics and related others by exploring similar questions and additional content below.Recommended textbooks for you

Exploring Economics
Economics
ISBN:
9781544336329
Author:
Robert L. Sexton
Publisher:
SAGE Publications, Inc
Exploring Economics
Economics
ISBN:
9781544336329
Author:
Robert L. Sexton
Publisher:
SAGE Publications, Inc