Bookmarks Window Help 38% ng.cengage.com ouTube PowerPoint Chapter 8: CJC/Soc St... Mind Tap Cengage Learning A random sample is selected fro... how to inspect a GE MINDTAP Q Search this course r 8: Introduction to Hypothesis Testing Answer + 6. A random sample is selected from a normal population with a mean of u = 30 and a standard deviation of %3D o= 8. After a treatment is administered to the individuals in the sample, the sample mean is found to be M = 33. %3D a. If the sample consists of n = 16 scores, is the sample mean sufficient to conclude that the treatment n%3D has a significant effect? Use a two-tailed test with a = .05. b. If the sample consists of n = 64 scores, is the sample mean sufficient to conclude that the treatment has a significant effect? Use a two-tailed test with a = .05. %3D c. Comparing your answers for parts a and b, explain how the size of the sample influences the outcome of a hypothesis test. Cengage Learning A random sample is selected from a normal po... GE MINDTAP how to inspec Q Search this cou er 8: Introduction to Hypothesis Testing IImuences he outcOIme of a Inypoiesis test. * AA Answer + 8. Brunt, Rhee, and Zhong (2008) surveyed 557 undergraduate college students to examine their weight status, health behaviors, and diet. Using body mass index (BMI), they classified the students into four categories: underweight, healthy weight, overweight, and obese. They also measured dietary variety by counting the number of different foods each student ate from several food groups. Note that the researchers are not measuring the amount of food eaten, but rather the number of different foods eaten (variety, not quantity). Nonetheless, it was somewhat surprising that the results showed no differences among the four weight categories that were related to eating fatty and/or sugary snacks. Suppose a researcher conducting a follow up study obtains a sample of n = 25 students classified as healthy weight and a sample of n = 36 students classified as overweight. Each student completes the food variety questionnaire, and the healthy-weight group produces a mean of M = 4.01 for the fatty, sugary snack category compared to a mean of M = 4.48 for the overweight group. The results from the Brunt, Rhee, and Zhong study showed an overall mean variety score of µ = 4.22 for the discretionary sweets or %3D fats food group. Assume that the distribution of scores is approximately normal with a standard deviation of o = 0.60. a. Does the sample of n = 36 indicate that the number of fatty, sugary snacks eaten by overweight students is significantly different from the overall population mean? Use a two-tailed test with a = ,05. b. Based on the sample of n = 25 healthy-weight students, can you conclude that healthy-weight students eat significantly fewer fatty, sugary snacks than the overall population? Use a one-tailed test with a = .05.
Bookmarks Window Help 38% ng.cengage.com ouTube PowerPoint Chapter 8: CJC/Soc St... Mind Tap Cengage Learning A random sample is selected fro... how to inspect a GE MINDTAP Q Search this course r 8: Introduction to Hypothesis Testing Answer + 6. A random sample is selected from a normal population with a mean of u = 30 and a standard deviation of %3D o= 8. After a treatment is administered to the individuals in the sample, the sample mean is found to be M = 33. %3D a. If the sample consists of n = 16 scores, is the sample mean sufficient to conclude that the treatment n%3D has a significant effect? Use a two-tailed test with a = .05. b. If the sample consists of n = 64 scores, is the sample mean sufficient to conclude that the treatment has a significant effect? Use a two-tailed test with a = .05. %3D c. Comparing your answers for parts a and b, explain how the size of the sample influences the outcome of a hypothesis test. Cengage Learning A random sample is selected from a normal po... GE MINDTAP how to inspec Q Search this cou er 8: Introduction to Hypothesis Testing IImuences he outcOIme of a Inypoiesis test. * AA Answer + 8. Brunt, Rhee, and Zhong (2008) surveyed 557 undergraduate college students to examine their weight status, health behaviors, and diet. Using body mass index (BMI), they classified the students into four categories: underweight, healthy weight, overweight, and obese. They also measured dietary variety by counting the number of different foods each student ate from several food groups. Note that the researchers are not measuring the amount of food eaten, but rather the number of different foods eaten (variety, not quantity). Nonetheless, it was somewhat surprising that the results showed no differences among the four weight categories that were related to eating fatty and/or sugary snacks. Suppose a researcher conducting a follow up study obtains a sample of n = 25 students classified as healthy weight and a sample of n = 36 students classified as overweight. Each student completes the food variety questionnaire, and the healthy-weight group produces a mean of M = 4.01 for the fatty, sugary snack category compared to a mean of M = 4.48 for the overweight group. The results from the Brunt, Rhee, and Zhong study showed an overall mean variety score of µ = 4.22 for the discretionary sweets or %3D fats food group. Assume that the distribution of scores is approximately normal with a standard deviation of o = 0.60. a. Does the sample of n = 36 indicate that the number of fatty, sugary snacks eaten by overweight students is significantly different from the overall population mean? Use a two-tailed test with a = ,05. b. Based on the sample of n = 25 healthy-weight students, can you conclude that healthy-weight students eat significantly fewer fatty, sugary snacks than the overall population? Use a one-tailed test with a = .05.

MATLAB: An Introduction with Applications
6th Edition
ISBN:9781119256830
Author:Amos Gilat
Publisher:Amos Gilat
Chapter1: Starting With Matlab
Section: Chapter Questions
Problem 1P

Related questions
Question
Transcribed Image Text:Bookmarks Window Help
38%
ng.cengage.com
ouTube
PowerPoint Chapter 8: CJC/Soc St...
Mind Tap Cengage Learning
A random sample is selected fro...
how to inspect a
GE MINDTAP
Q Search this course
r 8: Introduction to Hypothesis Testing
Answer +
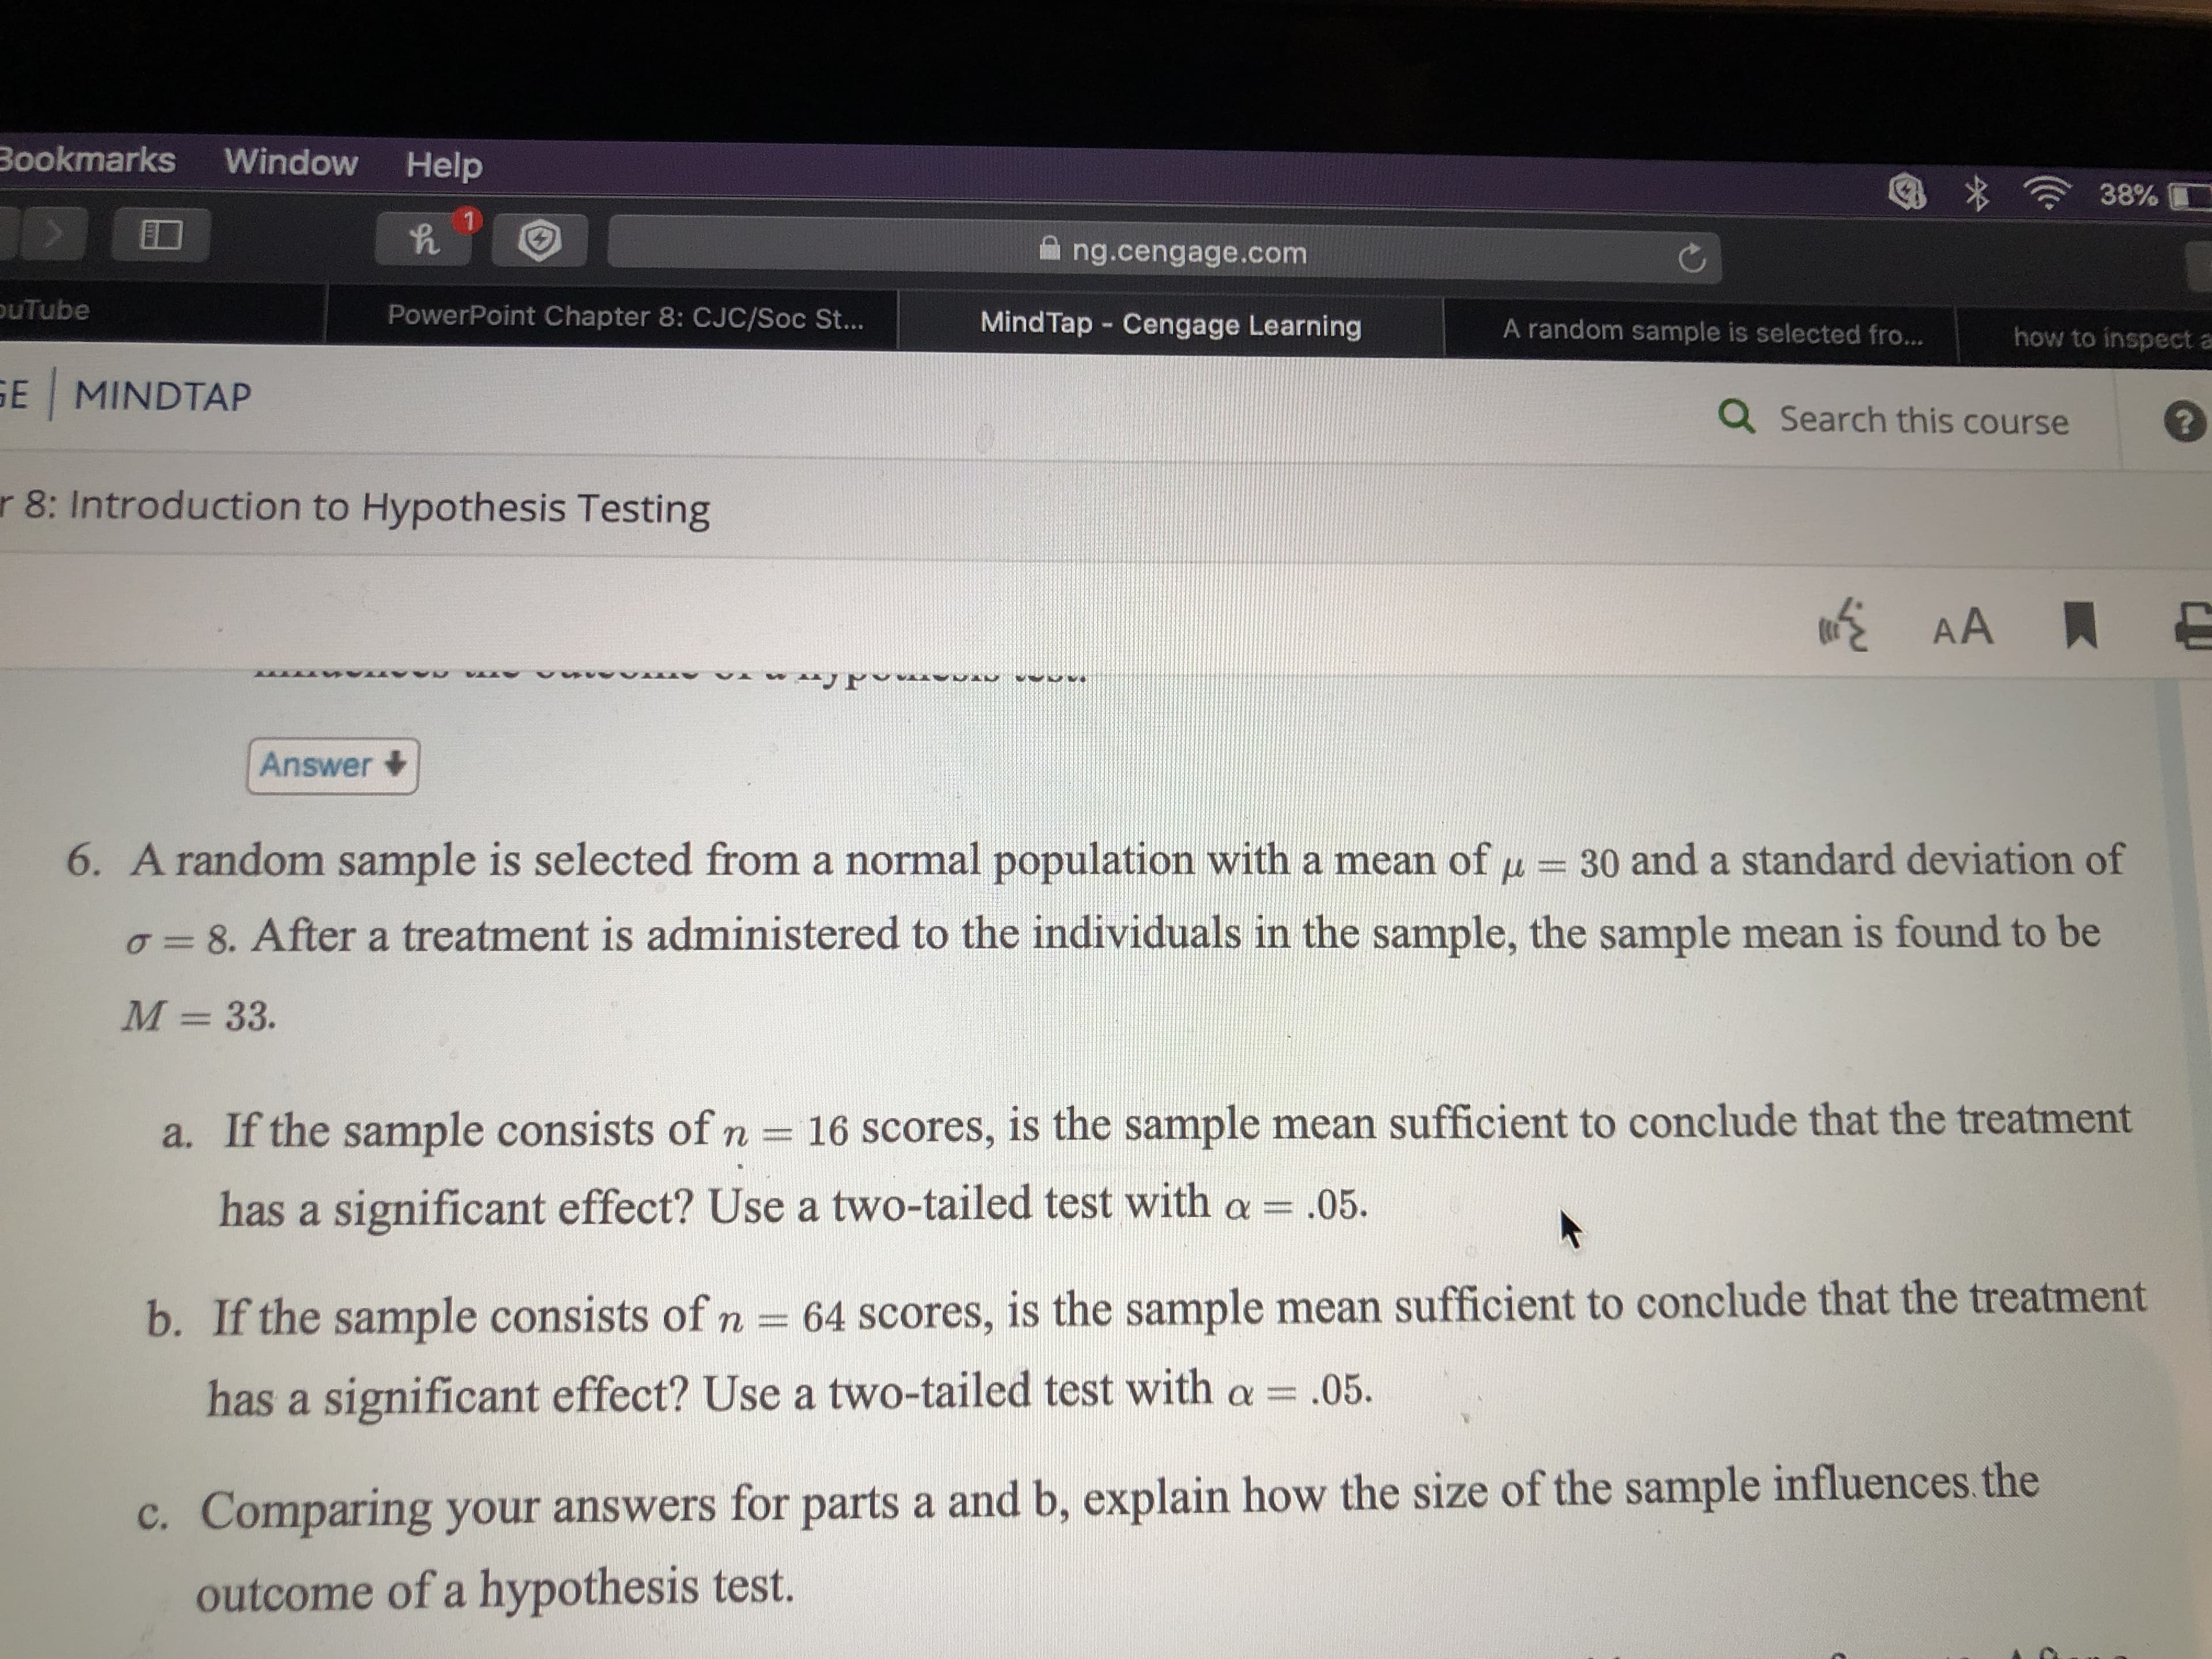
6. A random sample is selected from a normal population with a mean of u = 30 and a standard deviation of
%3D
o= 8. After a treatment is administered to the individuals in the sample, the sample mean is found to be
M = 33.
%3D
a. If the sample consists of n = 16 scores, is the sample mean sufficient to conclude that the treatment
n%3D
has a significant effect? Use a two-tailed test with a = .05.
b. If the sample consists of n = 64 scores, is the sample mean sufficient to conclude that the treatment
has a significant effect? Use a two-tailed test with a = .05.
%3D
c. Comparing your answers for parts a and b, explain how the size of the sample influences the
outcome of a hypothesis test.
Transcribed Image Text:Cengage Learning
A random sample is selected from a normal po...
GE MINDTAP
how to inspec
Q Search this cou
er 8: Introduction to Hypothesis Testing
IImuences he outcOIme of a Inypoiesis test.
* AA
Answer +
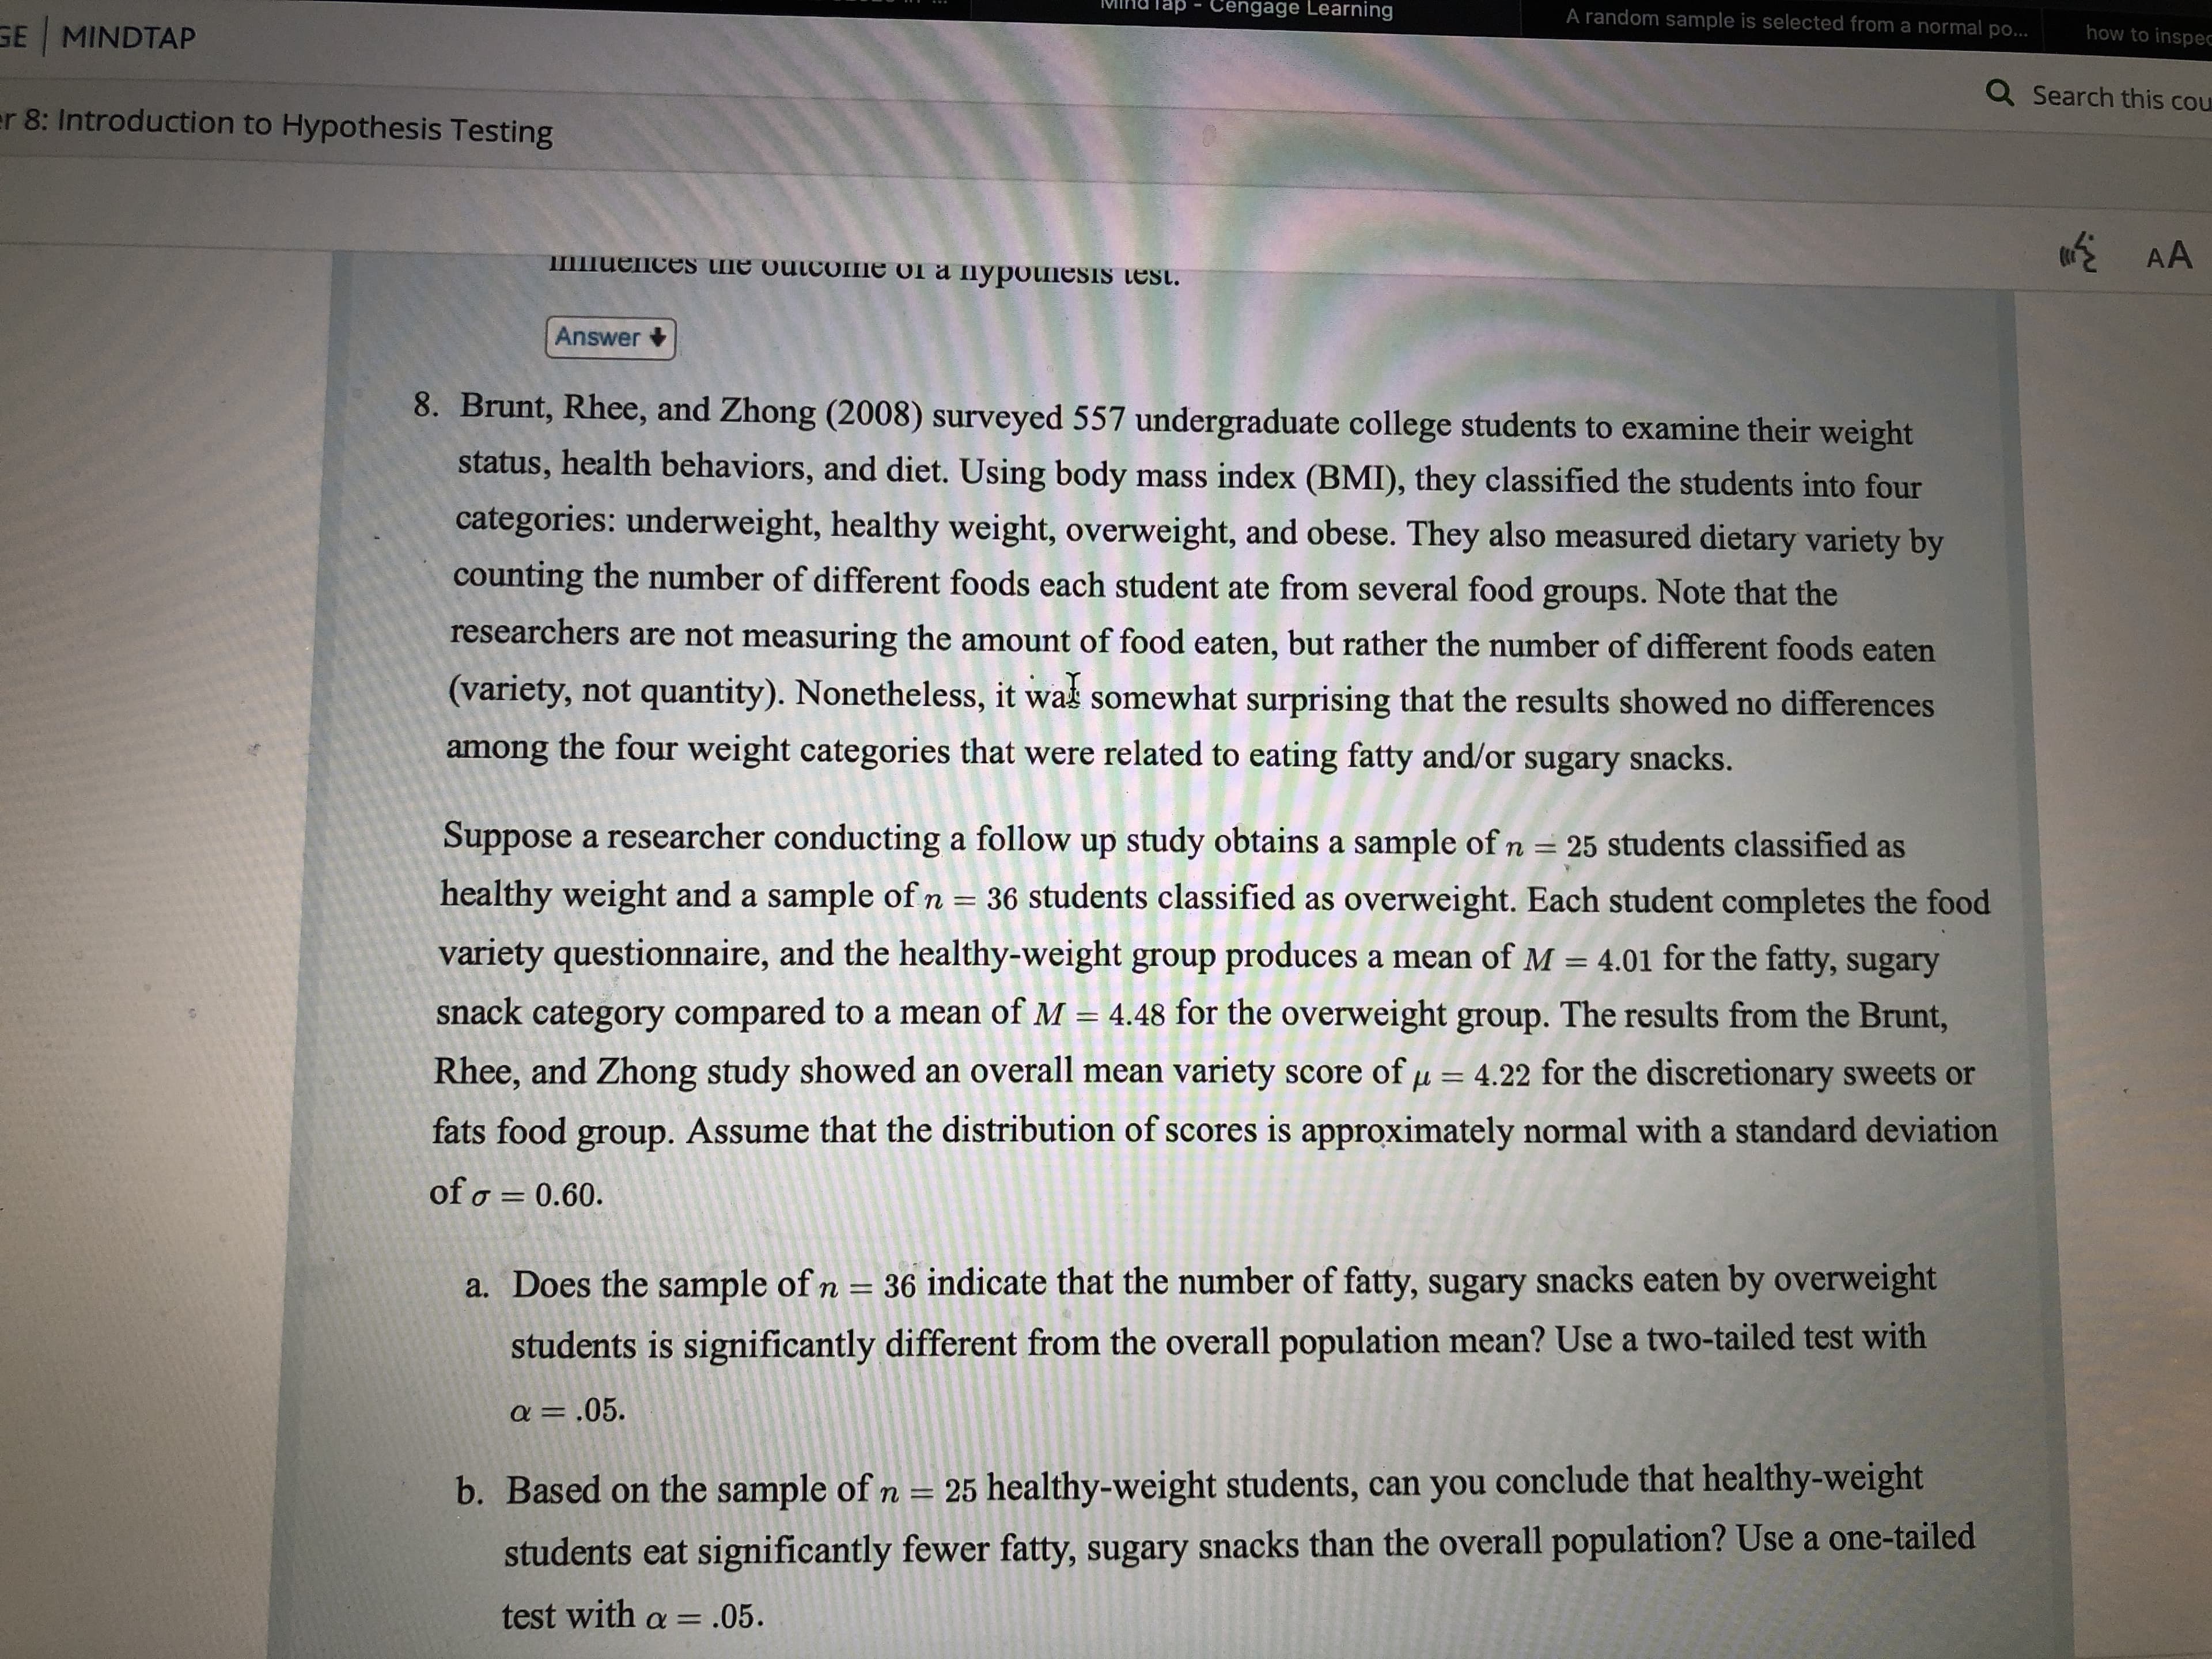
8. Brunt, Rhee, and Zhong (2008) surveyed 557 undergraduate college students to examine their weight
status, health behaviors, and diet. Using body mass index (BMI), they classified the students into four
categories: underweight, healthy weight, overweight, and obese. They also measured dietary variety by
counting the number of different foods each student ate from several food groups. Note that the
researchers are not measuring the amount of food eaten, but rather the number of different foods eaten
(variety, not quantity). Nonetheless, it was somewhat surprising that the results showed no differences
among the four weight categories that were related to eating fatty and/or sugary snacks.
Suppose a researcher conducting a follow up study obtains a sample of n = 25 students classified as
healthy weight and a sample of n = 36 students classified as overweight. Each student completes the food
variety questionnaire, and the healthy-weight group produces a mean of M = 4.01 for the fatty, sugary
snack category compared to a mean of M = 4.48 for the overweight group. The results from the Brunt,
Rhee, and Zhong study showed an overall mean variety score of µ = 4.22 for the discretionary sweets or
%3D
fats food group. Assume that the distribution of scores is approximately normal with a standard deviation
of o = 0.60.
a. Does the sample of n = 36 indicate that the number of fatty, sugary snacks eaten by overweight
students is significantly different from the overall population mean? Use a two-tailed test with
a = ,05.
b. Based on the sample of n =
25 healthy-weight students, can you conclude that healthy-weight
students eat significantly fewer fatty, sugary snacks than the overall population? Use a one-tailed
test with a = .05.
Expert Solution
This question has been solved!
Explore an expertly crafted, step-by-step solution for a thorough understanding of key concepts.

This is a popular solution!

Trending now
This is a popular solution!

Step by step
Solved in 7 steps with 5 images

Recommended textbooks for you
MATLAB: An Introduction with Applications
Statistics
ISBN:
9781119256830
Author:
Amos Gilat
Publisher:
John Wiley & Sons Inc

Probability and Statistics for Engineering and th…
Statistics
ISBN:
9781305251809
Author:
Jay L. Devore
Publisher:
Cengage Learning

Statistics for The Behavioral Sciences (MindTap C…
Statistics
ISBN:
9781305504912
Author:
Frederick J Gravetter, Larry B. Wallnau
Publisher:
Cengage Learning
MATLAB: An Introduction with Applications
Statistics
ISBN:
9781119256830
Author:
Amos Gilat
Publisher:
John Wiley & Sons Inc
Probability and Statistics for Engineering and th…
Statistics
ISBN:
9781305251809
Author:
Jay L. Devore
Publisher:
Cengage Learning
Statistics for The Behavioral Sciences (MindTap C…
Statistics
ISBN:
9781305504912
Author:
Frederick J Gravetter, Larry B. Wallnau
Publisher:
Cengage Learning

Elementary Statistics: Picturing the World (7th E…
Statistics
ISBN:
9780134683416
Author:
Ron Larson, Betsy Farber
Publisher:
PEARSON

The Basic Practice of Statistics
Statistics
ISBN:
9781319042578
Author:
David S. Moore, William I. Notz, Michael A. Fligner
Publisher:
W. H. Freeman

Introduction to the Practice of Statistics
Statistics
ISBN:
9781319013387
Author:
David S. Moore, George P. McCabe, Bruce A. Craig
Publisher:
W. H. Freeman