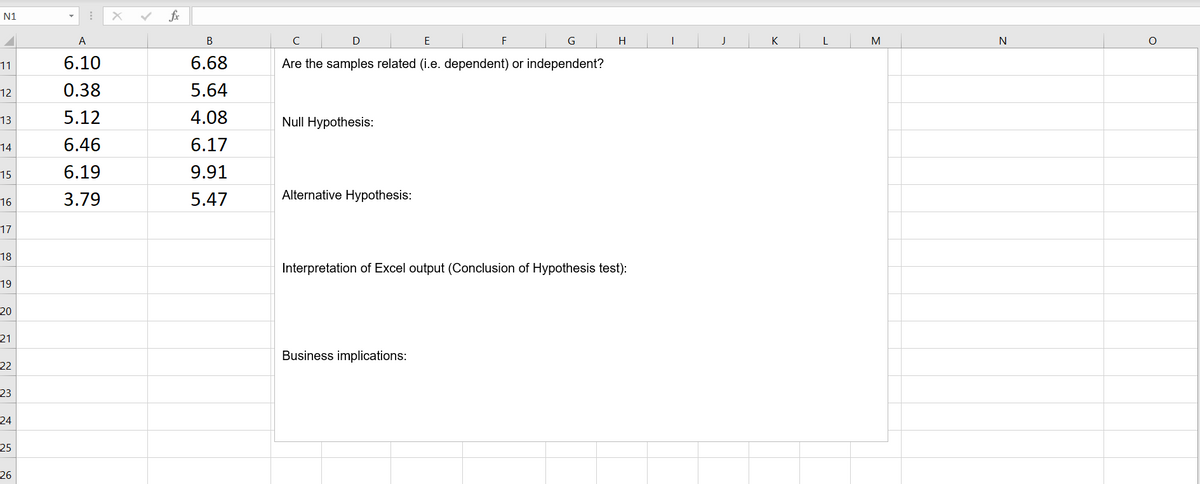
Are the samples related (i.e. dependent) or independent? Null Hypothesis: Alternative Hypothesis: Interpretation of Excel output (Conclusion of Hypothesis test): Business implications:
Are the samples related (i.e. dependent) or independent? Null Hypothesis: Alternative Hypothesis: Interpretation of Excel output (Conclusion of Hypothesis test): Business implications:

MATLAB: An Introduction with Applications
6th Edition
ISBN:9781119256830
Author:Amos Gilat
Publisher:Amos Gilat
Chapter1: Starting With Matlab
Section: Chapter Questions
Problem 1P

Related questions
Question
Transcribed Image Text:N1
fx
A
В
C
E
F
G
H
K
M
N
6.10
6.68
Are the samples related (i.e. dependent) or independent?
11
12
0.38
5.64
5.12
4.08
Null Hypothesis:
13
14
6.46
6.17
15
6.19
9.91
3.79
5.47
Alternative Hypothesis:
16
17
18
Interpretation of Excel output (Conclusion of Hypothesis test):
19
20
21
Business implications:
22
23
24
25
26
Transcribed Image Text:N1
fr
A
В
C
E
F
G
H
K
M
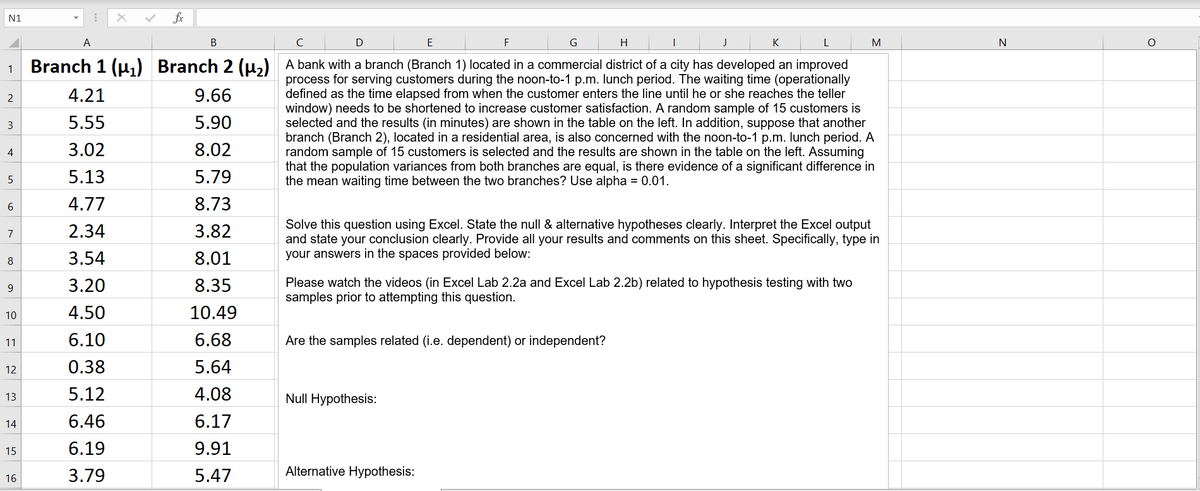
Branch 1 (u,) Branch 2 (u,) A bank with a branch (Branch 1) located in a commercial district of a city has developed an improved
process for serving customers during the noon-to-1 p.m. lunch period. The waiting time (operationally
defined as the time elapsed from when the customer enters the line until he or she reaches the teller
window) needs to be shortened to increase customer satisfaction. A random sample of 15 customers is
selected and the results (in minutes) are shown in the table on the left. In addition, suppose that another
branch (Branch 2), located in a residential area, is also concerned with the noon-to-1 p.m. lunch period. A
random sample of 15 customers is selected and the results are shown in the table on the left. Assuming
that the population variances from both branches are equal, is there evidence of a significant difference in
the mean waiting time between the two branches? Use alpha = 0.01.
4.21
9.66
2
3
5.55
5.90
3.02
8.02
4
5.13
5.79
6
4.77
8.73
Solve this question using Excel. State the null & alternative hypotheses clearly. Interpret the Excel output
and state your conclusion clearly. Provide all your results and comments on this sheet. Specifically, type in
your answers in the spaces provided below:
7
2.34
3.82
8
3.54
8.01
Please watch the videos (in Excel Lab 2.2a and Excel Lab 2.2b) related to hypothesis testing with two
samples prior to attempting this question.
9
3.20
8.35
10
4.50
10.49
11
6.10
6.68
Are the samples related (i.e. dependent) or independent?
12
0.38
5.64
5.12
4.08
Null Hypothesis:
13
14
6.46
6.17
15
6.19
9.91
3.79
5.47
Alternative Hypothesis:
16
Expert Solution
This question has been solved!
Explore an expertly crafted, step-by-step solution for a thorough understanding of key concepts.

This is a popular solution!

Trending now
This is a popular solution!

Step by step
Solved in 3 steps with 1 images

Knowledge Booster


Learn more about
Need a deep-dive on the concept behind this application? Look no further. Learn more about this topic, statistics and related others by exploring similar questions and additional content below.Recommended textbooks for you
MATLAB: An Introduction with Applications
Statistics
ISBN:
9781119256830
Author:
Amos Gilat
Publisher:
John Wiley & Sons Inc

Probability and Statistics for Engineering and th…
Statistics
ISBN:
9781305251809
Author:
Jay L. Devore
Publisher:
Cengage Learning

Statistics for The Behavioral Sciences (MindTap C…
Statistics
ISBN:
9781305504912
Author:
Frederick J Gravetter, Larry B. Wallnau
Publisher:
Cengage Learning
MATLAB: An Introduction with Applications
Statistics
ISBN:
9781119256830
Author:
Amos Gilat
Publisher:
John Wiley & Sons Inc
Probability and Statistics for Engineering and th…
Statistics
ISBN:
9781305251809
Author:
Jay L. Devore
Publisher:
Cengage Learning
Statistics for The Behavioral Sciences (MindTap C…
Statistics
ISBN:
9781305504912
Author:
Frederick J Gravetter, Larry B. Wallnau
Publisher:
Cengage Learning

Elementary Statistics: Picturing the World (7th E…
Statistics
ISBN:
9780134683416
Author:
Ron Larson, Betsy Farber
Publisher:
PEARSON

The Basic Practice of Statistics
Statistics
ISBN:
9781319042578
Author:
David S. Moore, William I. Notz, Michael A. Fligner
Publisher:
W. H. Freeman

Introduction to the Practice of Statistics
Statistics
ISBN:
9781319013387
Author:
David S. Moore, George P. McCabe, Bruce A. Craig
Publisher:
W. H. Freeman