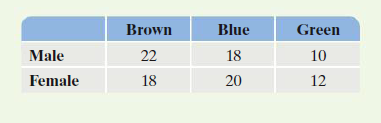
Brown Blue Green Male 22 18 10 Female 18 20 12


Contingency Table
A contingency table can be defined as the visual representation of the relationship between two or more categorical variables that can be evaluated and registered. It is a categorical version of the scatterplot, which is used to investigate the linear relationship between two variables. A contingency table is indeed a type of frequency distribution table that displays two variables at the same time.
Binomial Distribution
Binomial is an algebraic expression of the sum or the difference of two terms. Before knowing about binomial distribution, we must know about the binomial theorem.
A class is collecting data on eye color and gender. They organize the data they collected into the table shown. Numbers in the table represent the number of students from the class that belong to each of the categories. Use the data to solve, Find the probability that a randomly selected student from the class represented in the shown table has brown eyes or blue eyes. Express probabilities as simplified fractions.


Trending now
This is a popular solution!

Step by step
Solved in 2 steps with 1 images


