BUS Ch9 10 The Monopolist view of Total Revenue, Average Revenue, and Marginal Revenue. 33. The demand curve the monopolist faces is the firm's AR Fnce curve. 34. TR, = PQ 35. AR, - P.*Q /Q, - P. 36. What is the relationship between marginal values and average values? 37. As Q 1: If MR>AR then AR 1 38. As Q 1: I MR< AR then AR; 39. What is AR dolng as Q T ?? 40. What is the implication of MR=0? 5:12 / 5:40 YouTube CC 5. In the video, the graph indicates that firm's average revenue curve is the market elect one: D a. demand curve O b. supply curve D c. equilibrium Check
BUS Ch9 10 The Monopolist view of Total Revenue, Average Revenue, and Marginal Revenue. 33. The demand curve the monopolist faces is the firm's AR Fnce curve. 34. TR, = PQ 35. AR, - P.*Q /Q, - P. 36. What is the relationship between marginal values and average values? 37. As Q 1: If MR>AR then AR 1 38. As Q 1: I MR< AR then AR; 39. What is AR dolng as Q T ?? 40. What is the implication of MR=0? 5:12 / 5:40 YouTube CC 5. In the video, the graph indicates that firm's average revenue curve is the market elect one: D a. demand curve O b. supply curve D c. equilibrium Check

Principles of Economics 2e
2nd Edition
ISBN:9781947172364
Author:Steven A. Greenlaw; David Shapiro
Publisher:Steven A. Greenlaw; David Shapiro
Chapter9: Monopoly
Section: Chapter Questions
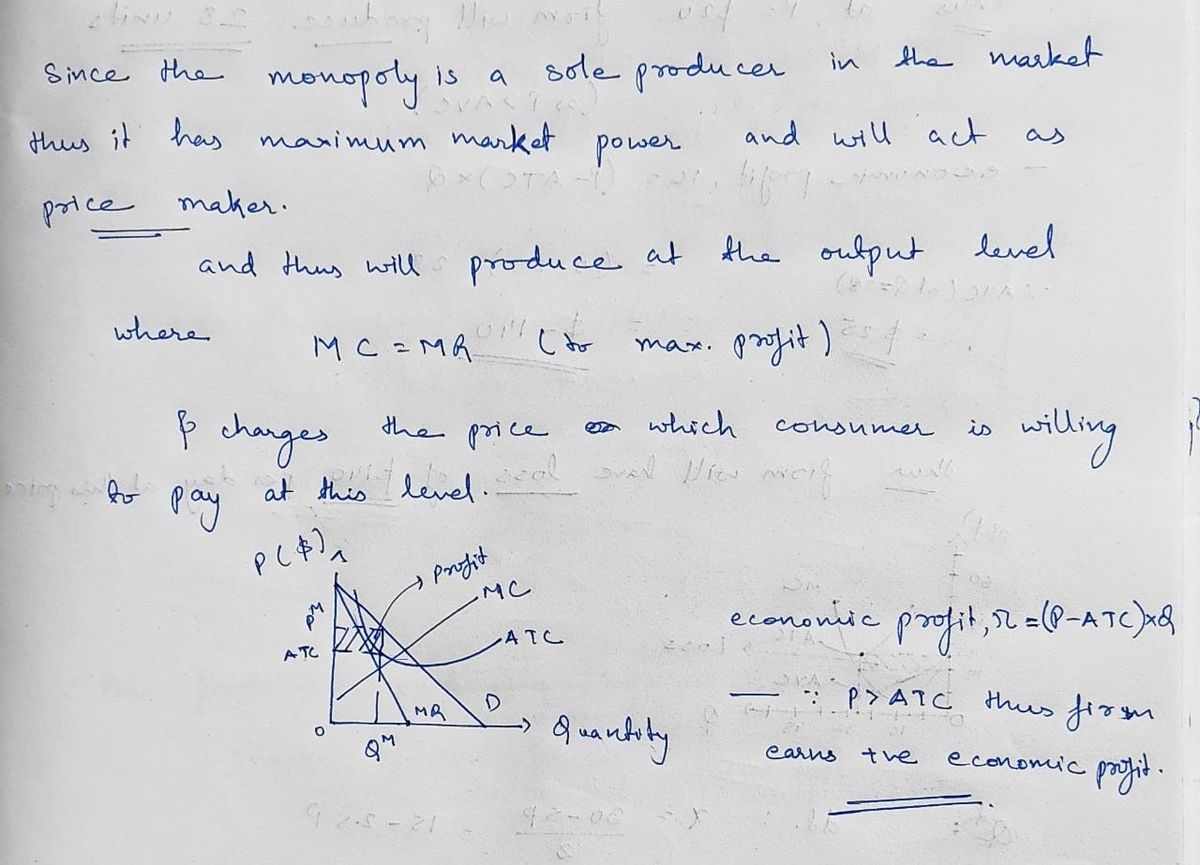
Problem 33P: Draw a monopolists demand curve, marginal revenue, and marginal cost curves. Identify the...

Related questions
Question
100%
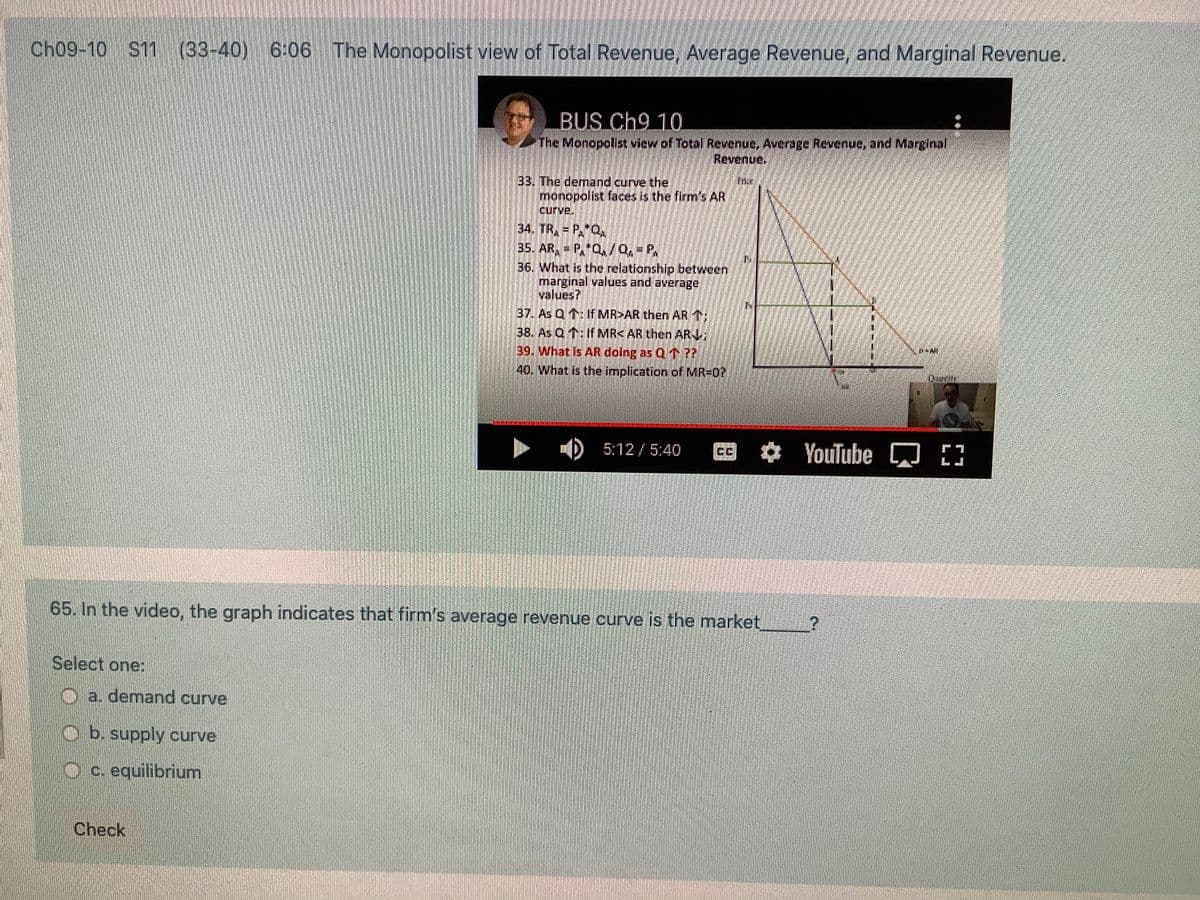
Transcribed Image Text:Ch09-10 S11 (33-40) 6:06 The Monopolist view of Total Revenue, Average Revenue, and Marginal Revenue.
BUS Ch9 10
The Monopolist view of Total Revenue, Average Revenue, and Marginal
Revenue.
33. The demand curve the
monopolist faces is the firm's AR
curve.
34. TR, = P,"Q
35. AR, = P, Q,/Q, = P,
36. What is the relationship between
marginal values and average
values?
37. As Q t: If MR>AR then AR 1,
38. As Q t: If MR< AR then AR L;
39. What is AR doing as Q 1 ??
40. What is the implication of MR-0P
ID 5:12/5:40
YouTube
65. In the video, the graph indicates that firm's average revenue curve is the market
Select one:
a. demand curve
Ob. supply curve
O c. equilibrium
Check
Expert Solution
Step 1

Step by step
Solved in 2 steps with 2 images

Knowledge Booster


Learn more about
Need a deep-dive on the concept behind this application? Look no further. Learn more about this topic, economics and related others by exploring similar questions and additional content below.Recommended textbooks for you
Principles of Economics 2e
Economics
ISBN:
9781947172364
Author:
Steven A. Greenlaw; David Shapiro
Publisher:
OpenStax


Principles of Economics 2e
Economics
ISBN:
9781947172364
Author:
Steven A. Greenlaw; David Shapiro
Publisher:
OpenStax


Managerial Economics: A Problem Solving Approach
Economics
ISBN:
9781337106665
Author:
Luke M. Froeb, Brian T. McCann, Michael R. Ward, Mike Shor
Publisher:
Cengage Learning