By 2019, nearly $1 out of every $5 Spent in the US economy is projected to go for healthcare the bar graph shows the percentage of the US gross domestic product GDP going towards health care from 2007 through 2014 with a projection for 2019. The data can be modeled by the function f(x) = 1.2Inx + 15.7, Where FX is the percentage of the US gross domestic product going towards healthcare X years after a 2006. Use the function to determine the partys centage of the US gross domestic product that went towards healthcare and 2009 round to the nearest 10th of a percent this is underestimate her overestimate the percent ship displayed by the graph? by how much? According to the model when well 18.6% of the gross domestic product go towards health care? Round to the nearest year


Minimization
In mathematics, traditional optimization problems are typically expressed in terms of minimization. When we talk about minimizing or maximizing a function, we refer to the maximum and minimum possible values of that function. This can be expressed in terms of global or local range. The definition of minimization in the thesaurus is the process of reducing something to a small amount, value, or position. Minimization (noun) is an instance of belittling or disparagement.
Maxima and Minima
The extreme points of a function are the maximum and the minimum points of the function. A maximum is attained when the function takes the maximum value and a minimum is attained when the function takes the minimum value.
Derivatives
A derivative means a change. Geometrically it can be represented as a line with some steepness. Imagine climbing a mountain which is very steep and 500 meters high. Is it easier to climb? Definitely not! Suppose walking on the road for 500 meters. Which one would be easier? Walking on the road would be much easier than climbing a mountain.
Concavity
In calculus, concavity is a descriptor of mathematics that tells about the shape of the graph. It is the parameter that helps to estimate the maximum and minimum value of any of the functions and the concave nature using the graphical method. We use the first derivative test and second derivative test to understand the concave behavior of the function.
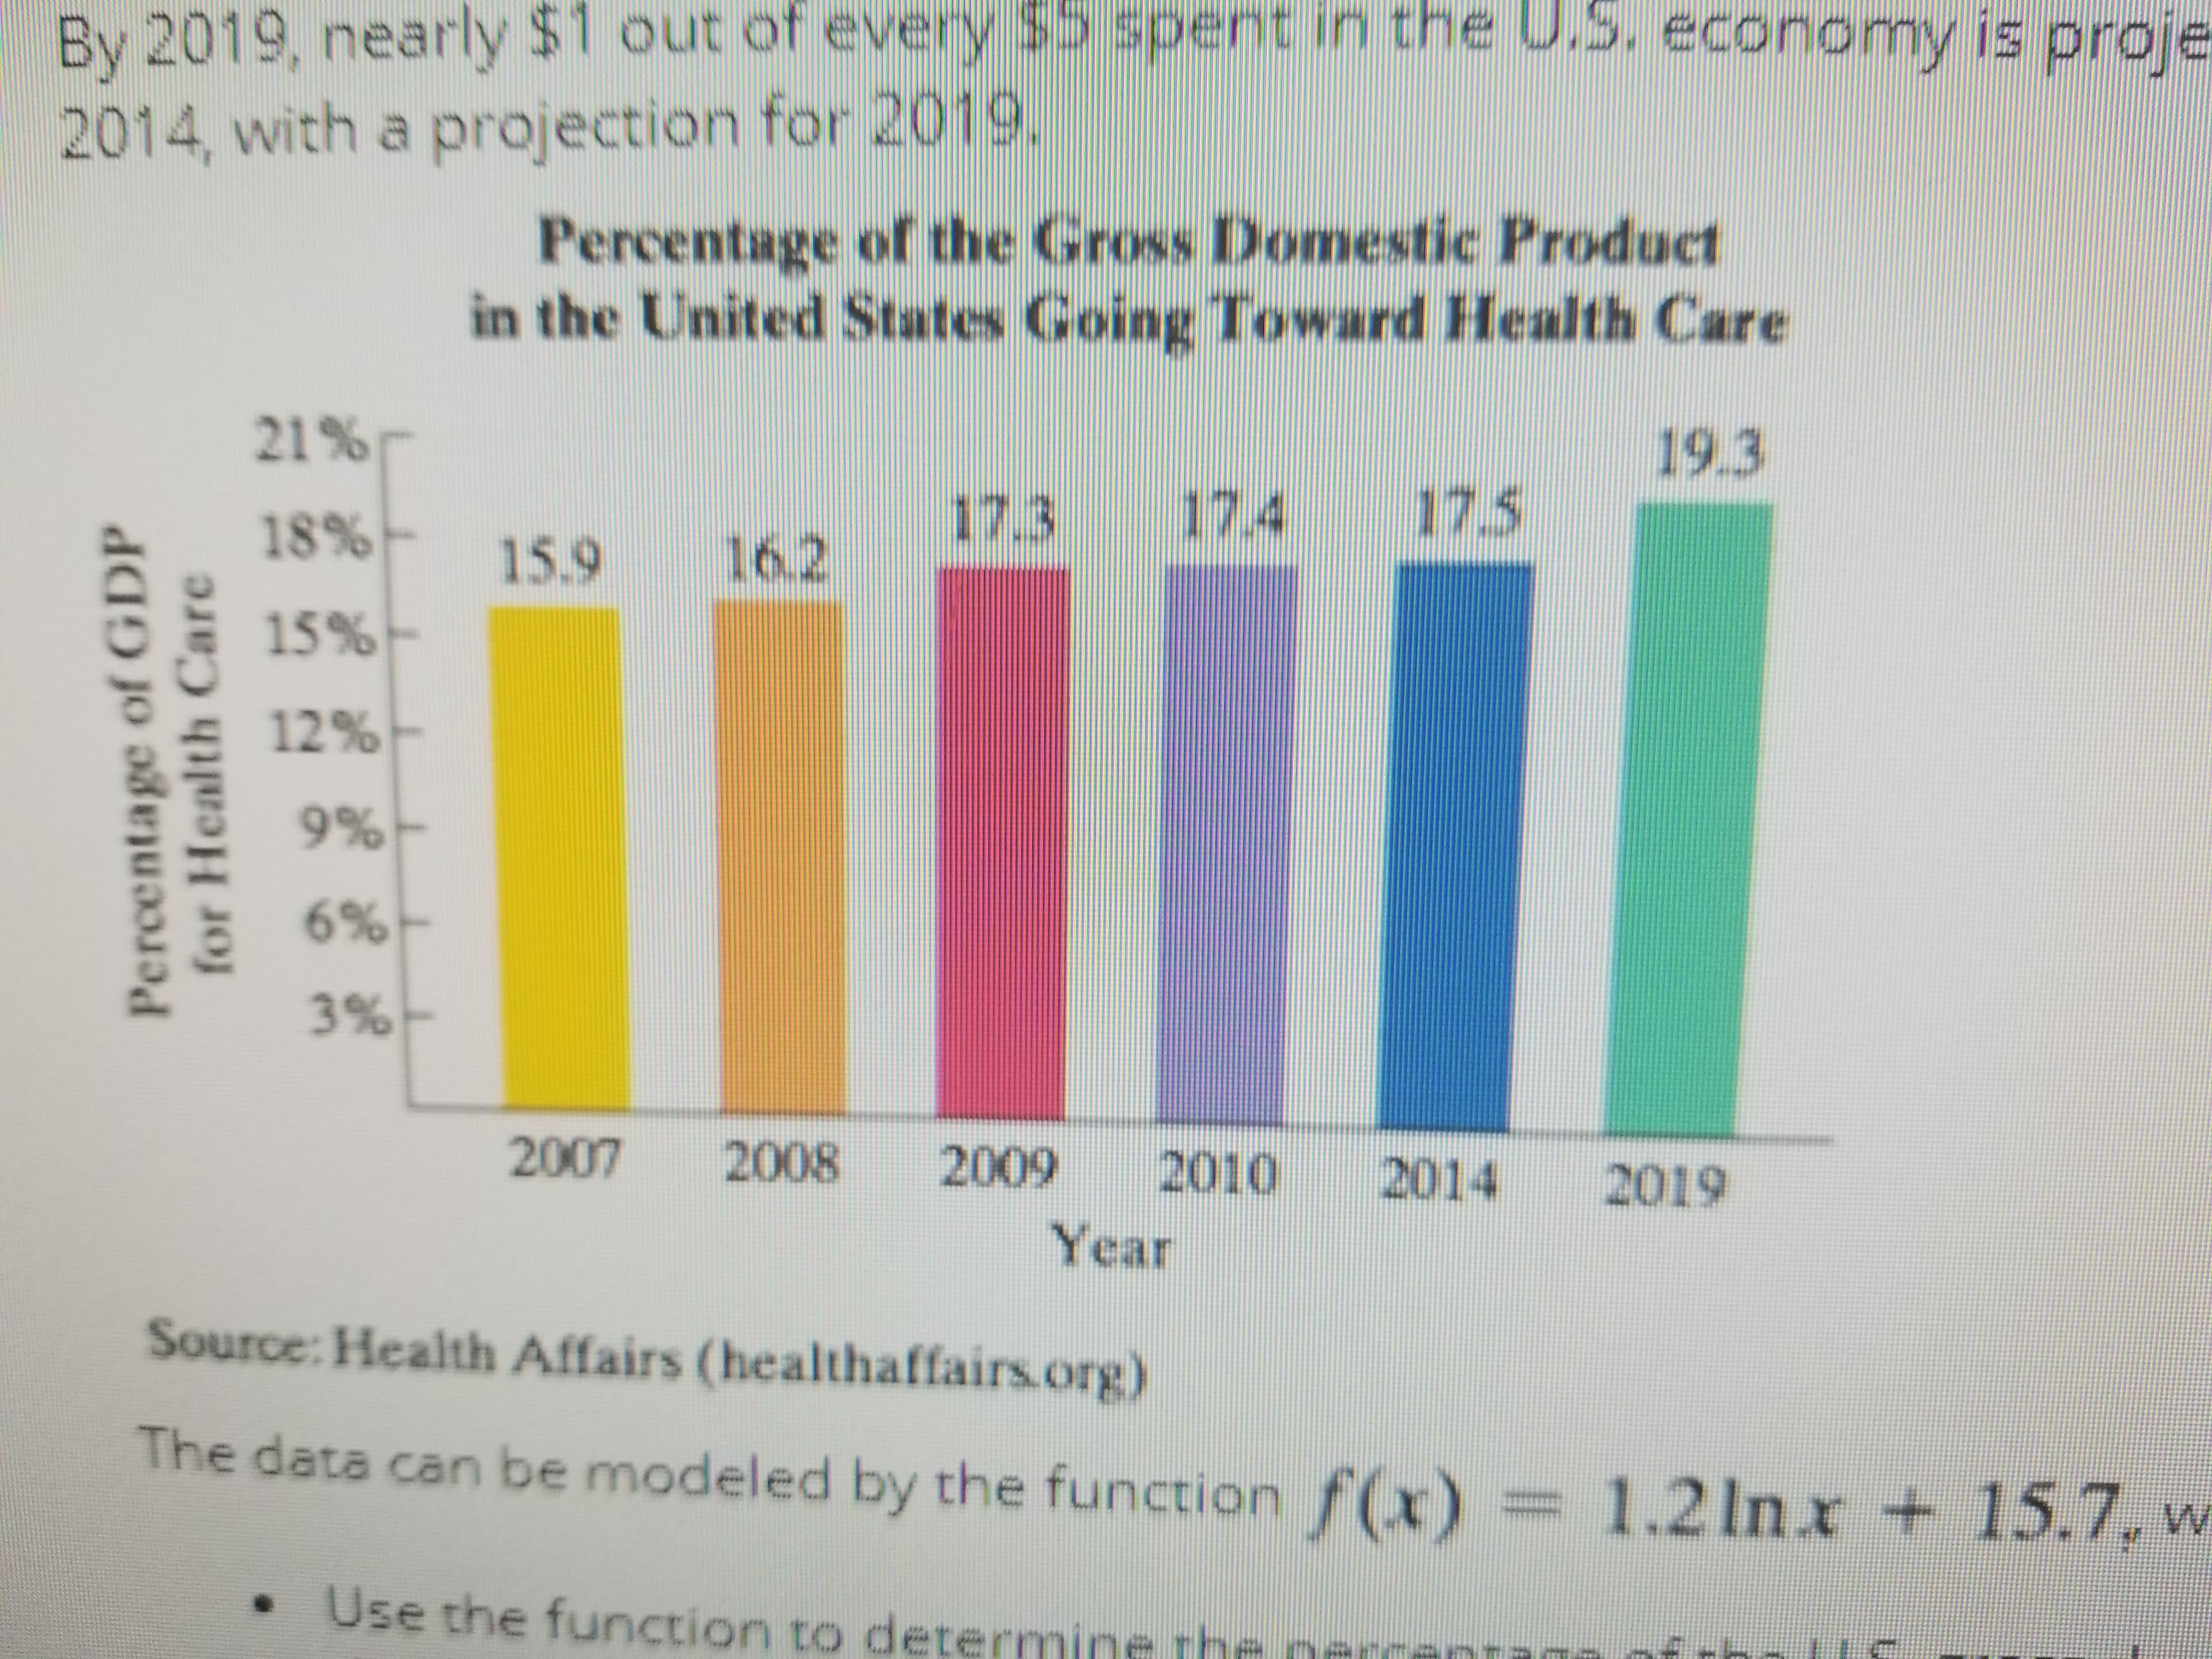
By 2019, nearly $1 out of every $5 Spent in the US economy is projected to go for healthcare the bar graph shows the percentage of the US gross domestic product GDP going towards health care from 2007 through 2014 with a projection for 2019.
The data can be modeled by the function f(x) = 1.2Inx + 15.7, Where FX is the percentage of the US gross domestic product going towards healthcare X years after a 2006.
Use the function to determine the partys centage of the US gross domestic product that went towards healthcare and 2009 round to the nearest 10th of a percent this is underestimate her overestimate the percent ship displayed by the graph? by how much?
According to the model when well 18.6% of the gross domestic product go towards health care? Round to the nearest year


Trending now
This is a popular solution!

Step by step
Solved in 3 steps


