(c) What sample size would be required in each popula- tion if you wanted to be 95% confident that the error in estimating the difference in mean road octane number is less than 1?
(c) What sample size would be required in each popula- tion if you wanted to be 95% confident that the error in estimating the difference in mean road octane number is less than 1?

MATLAB: An Introduction with Applications
6th Edition
ISBN:9781119256830
Author:Amos Gilat
Publisher:Amos Gilat
Chapter1: Starting With Matlab
Section: Chapter Questions
Problem 1P

Related questions
Question
Only solve exercise C)
In the other image, this is the correct answer, (just to check)
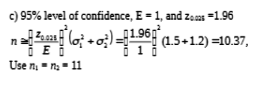
Transcribed Image Text:c) 95% level of confidence, E = 1, and zes =1.96
국(o.어) 0.5+1.2) =10.37,
Use n, - na - 11
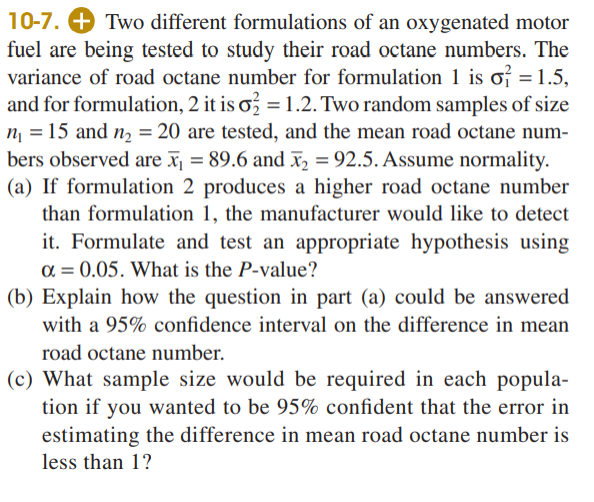
Transcribed Image Text:10-7. + Two different formulations of an oxygenated motor
fuel are being tested to study their road octane numbers. The
variance of road octane number for formulation 1 is of = 1.5,
and for formulation, 2 it is o = 1.2. Two random samples of size
n = 15 and n = 20 are tested, and the mean road octane num-
bers observed are x¡ = 89.6 and x = 92.5. Assume normality.
(a) If formulation 2 produces a higher road octane number
than formulation 1, the manufacturer would like to detect
it. Formulate and test an appropriate hypothesis using
a = 0.05. What is the P-value?
(b) Explain how the question in part (a) could be answered
with a 95% confidence interval on the difference in mean
road octane number.
(c) What sample size would be required in each popula-
tion if you wanted to be 95% confident that the error in
estimating the difference in mean road octane number is
less than 1?
Expert Solution
This question has been solved!
Explore an expertly crafted, step-by-step solution for a thorough understanding of key concepts.

This is a popular solution!

Trending now
This is a popular solution!

Step by step
Solved in 2 steps

Recommended textbooks for you
MATLAB: An Introduction with Applications
Statistics
ISBN:
9781119256830
Author:
Amos Gilat
Publisher:
John Wiley & Sons Inc

Probability and Statistics for Engineering and th…
Statistics
ISBN:
9781305251809
Author:
Jay L. Devore
Publisher:
Cengage Learning

Statistics for The Behavioral Sciences (MindTap C…
Statistics
ISBN:
9781305504912
Author:
Frederick J Gravetter, Larry B. Wallnau
Publisher:
Cengage Learning
MATLAB: An Introduction with Applications
Statistics
ISBN:
9781119256830
Author:
Amos Gilat
Publisher:
John Wiley & Sons Inc
Probability and Statistics for Engineering and th…
Statistics
ISBN:
9781305251809
Author:
Jay L. Devore
Publisher:
Cengage Learning
Statistics for The Behavioral Sciences (MindTap C…
Statistics
ISBN:
9781305504912
Author:
Frederick J Gravetter, Larry B. Wallnau
Publisher:
Cengage Learning

Elementary Statistics: Picturing the World (7th E…
Statistics
ISBN:
9780134683416
Author:
Ron Larson, Betsy Farber
Publisher:
PEARSON

The Basic Practice of Statistics
Statistics
ISBN:
9781319042578
Author:
David S. Moore, William I. Notz, Michael A. Fligner
Publisher:
W. H. Freeman

Introduction to the Practice of Statistics
Statistics
ISBN:
9781319013387
Author:
David S. Moore, George P. McCabe, Bruce A. Craig
Publisher:
W. H. Freeman