C. Public good d. Comparative advantage e. Non-discrimination (in the GATT/WTO system) 3al 2. Consider a market in equilibrium where P = 100 and Q = 200. %3D Draw a supply and demand diagram of this equilibrium and label the equilibrium price and quantity. Next draw a price floor at P = 120 and show what happens to quantity demanded and quantity supplied in your diagram. a. b. Show and explain what happens to consumer surplus as a result of this price floor (you don't have to make any calculations here). c. Suppose that E = -0.8. Calculate the new quantity demanded at P = 120 and show your work. %3D d. Suppose that E = 1.4. Calculate the new quantity supplied at P = 120 and show your work. %3D %3D e. Given your work, calculate the excess supply that results from the price floor. 1.
C. Public good d. Comparative advantage e. Non-discrimination (in the GATT/WTO system) 3al 2. Consider a market in equilibrium where P = 100 and Q = 200. %3D Draw a supply and demand diagram of this equilibrium and label the equilibrium price and quantity. Next draw a price floor at P = 120 and show what happens to quantity demanded and quantity supplied in your diagram. a. b. Show and explain what happens to consumer surplus as a result of this price floor (you don't have to make any calculations here). c. Suppose that E = -0.8. Calculate the new quantity demanded at P = 120 and show your work. %3D d. Suppose that E = 1.4. Calculate the new quantity supplied at P = 120 and show your work. %3D %3D e. Given your work, calculate the excess supply that results from the price floor. 1.

Essentials of Economics (MindTap Course List)
8th Edition
ISBN:9781337091992
Author:N. Gregory Mankiw
Publisher:N. Gregory Mankiw
Chapter6: Supply, Demand And Government Policies
Section: Chapter Questions
Problem 10PA

Related questions
Question
100%
Need help with attached
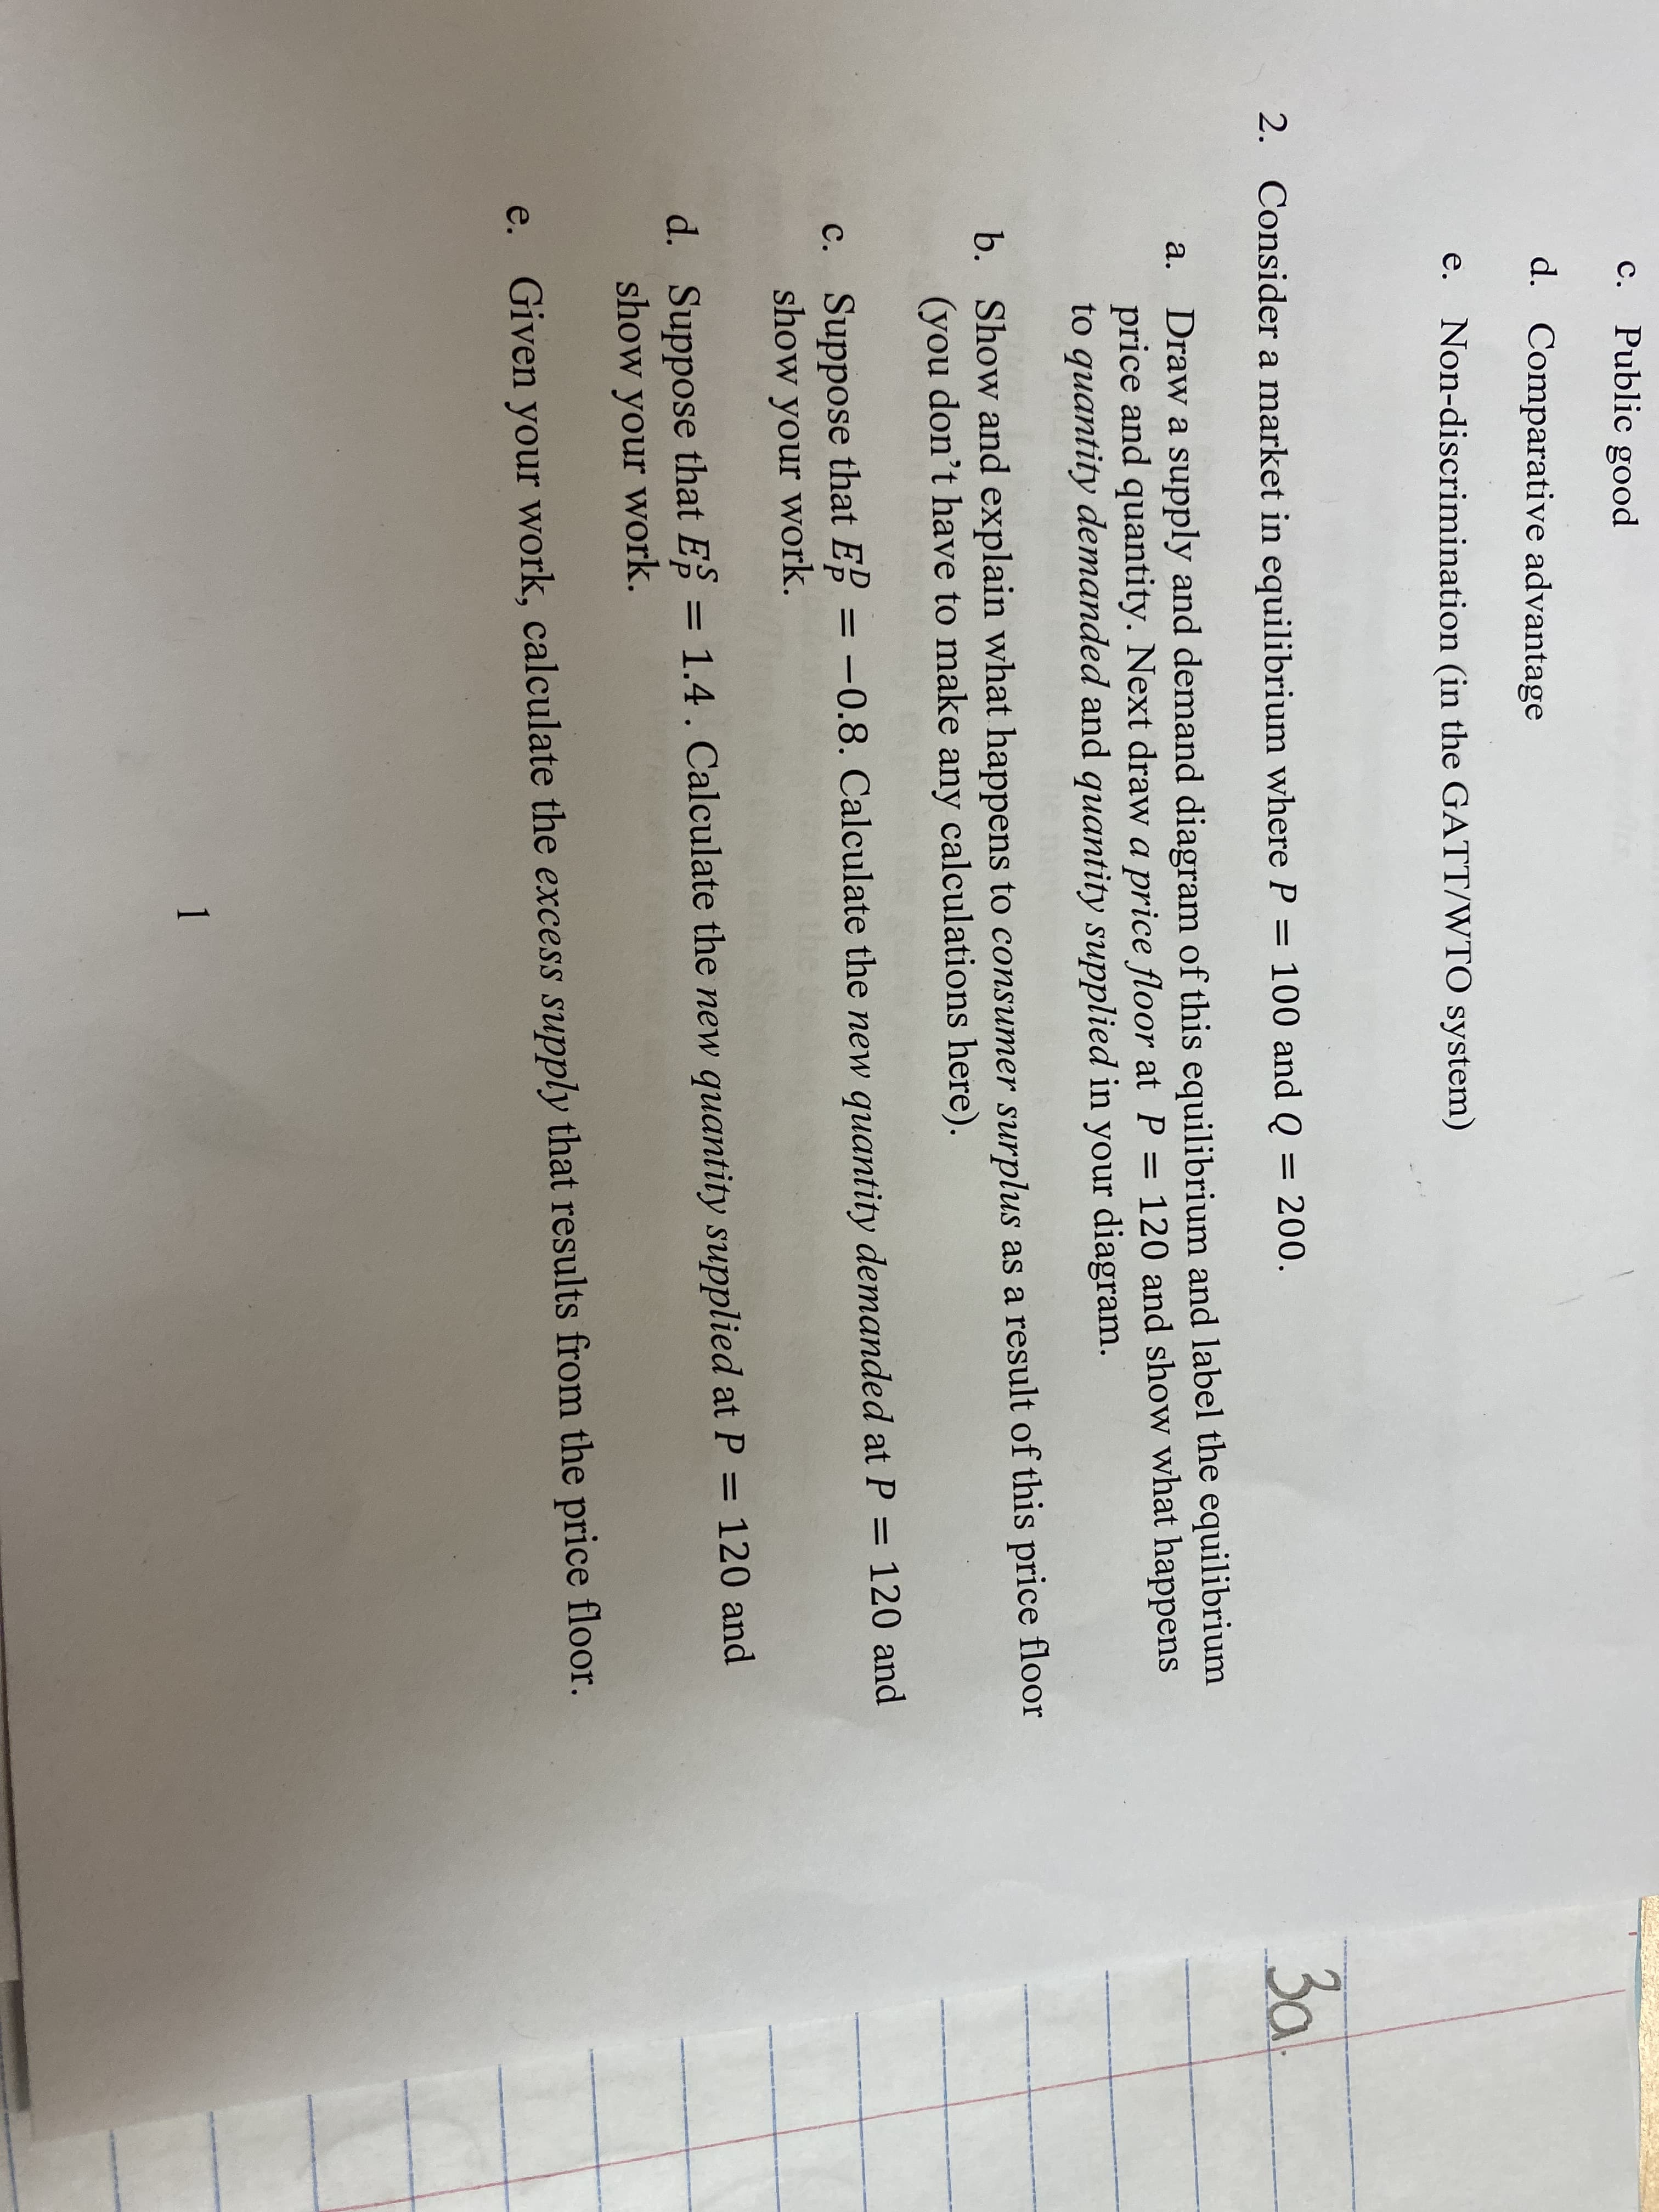
Transcribed Image Text:C.
Public good
d. Comparative advantage
e. Non-discrimination (in the GATT/WTO system)
3al
2.
Consider a market in equilibrium where P = 100 and Q = 200.
%3D
Draw a supply and demand diagram of this equilibrium and label the equilibrium
price and quantity. Next draw a price floor at P = 120 and show what happens
to quantity demanded and quantity supplied in your diagram.
a.
b. Show and explain what happens to consumer surplus as a result of this price floor
(you don't have to make any calculations here).
c. Suppose that E = -0.8. Calculate the new quantity demanded at P = 120 and
show your work.
%3D
d. Suppose that E = 1.4. Calculate the new quantity supplied at P = 120 and
show your work.
%3D
%3D
e.
Given your work, calculate the excess supply that results from the price floor.
1.
Expert Solution
This question has been solved!
Explore an expertly crafted, step-by-step solution for a thorough understanding of key concepts.

Step by step
Solved in 4 steps with 3 images

Knowledge Booster


Learn more about
Need a deep-dive on the concept behind this application? Look no further. Learn more about this topic, economics and related others by exploring similar questions and additional content below.Recommended textbooks for you
Essentials of Economics (MindTap Course List)
Economics
ISBN:
9781337091992
Author:
N. Gregory Mankiw
Publisher:
Cengage Learning

Principles of Economics (MindTap Course List)
Economics
ISBN:
9781305585126
Author:
N. Gregory Mankiw
Publisher:
Cengage Learning

Principles of Microeconomics (MindTap Course List)
Economics
ISBN:
9781305971493
Author:
N. Gregory Mankiw
Publisher:
Cengage Learning
Essentials of Economics (MindTap Course List)
Economics
ISBN:
9781337091992
Author:
N. Gregory Mankiw
Publisher:
Cengage Learning
Principles of Economics (MindTap Course List)
Economics
ISBN:
9781305585126
Author:
N. Gregory Mankiw
Publisher:
Cengage Learning
Principles of Microeconomics (MindTap Course List)
Economics
ISBN:
9781305971493
Author:
N. Gregory Mankiw
Publisher:
Cengage Learning

Principles of Macroeconomics (MindTap Course List)
Economics
ISBN:
9781305971509
Author:
N. Gregory Mankiw
Publisher:
Cengage Learning
