C4. In 2010, a U.S. Census Bureau report revealed that approximately 14.3% of all Americans were living below the poverty line in 2009. This figure is higher than in 2000, when the poverty rate was 12.2%. Individuals and families living below the poverty line face many obstacles, the least of which is access to health care. In many cases, those living below the poverty line are without any form of health insurance. Using data from the U.S. Census Bureau, analyze the relationship between living below the and access to health care for a random sample of 12 states. (The health insurance data are pre-Affordable Care Act implementation.) poverty line Percentage Below Poverty Line (2009) Percentage Without Health Insurance (2009) State 17.9 16.9 Alabama 20 14.2 California 15.2 14.3 Idaho 16 17.3 Louisiana 15.8 9.4 New Jersey 14.8 14.2 New York 11.4 12.5 Pennsylvania 12.3 11.5 Rhode Island 17.0 17.1 South Carolina (Continued)
C4. In 2010, a U.S. Census Bureau report revealed that approximately 14.3% of all Americans were living below the poverty line in 2009. This figure is higher than in 2000, when the poverty rate was 12.2%. Individuals and families living below the poverty line face many obstacles, the least of which is access to health care. In many cases, those living below the poverty line are without any form of health insurance. Using data from the U.S. Census Bureau, analyze the relationship between living below the and access to health care for a random sample of 12 states. (The health insurance data are pre-Affordable Care Act implementation.) poverty line Percentage Below Poverty Line (2009) Percentage Without Health Insurance (2009) State 17.9 16.9 Alabama 20 14.2 California 15.2 14.3 Idaho 16 17.3 Louisiana 15.8 9.4 New Jersey 14.8 14.2 New York 11.4 12.5 Pennsylvania 12.3 11.5 Rhode Island 17.0 17.1 South Carolina (Continued)

Chapter9: Sequences, Probability And Counting Theory
Section9.7: Probability
Problem 60SE: Use this data for the exercises that follow: In 2013, there were roughly 317 million citizens in the...

Related questions
Question
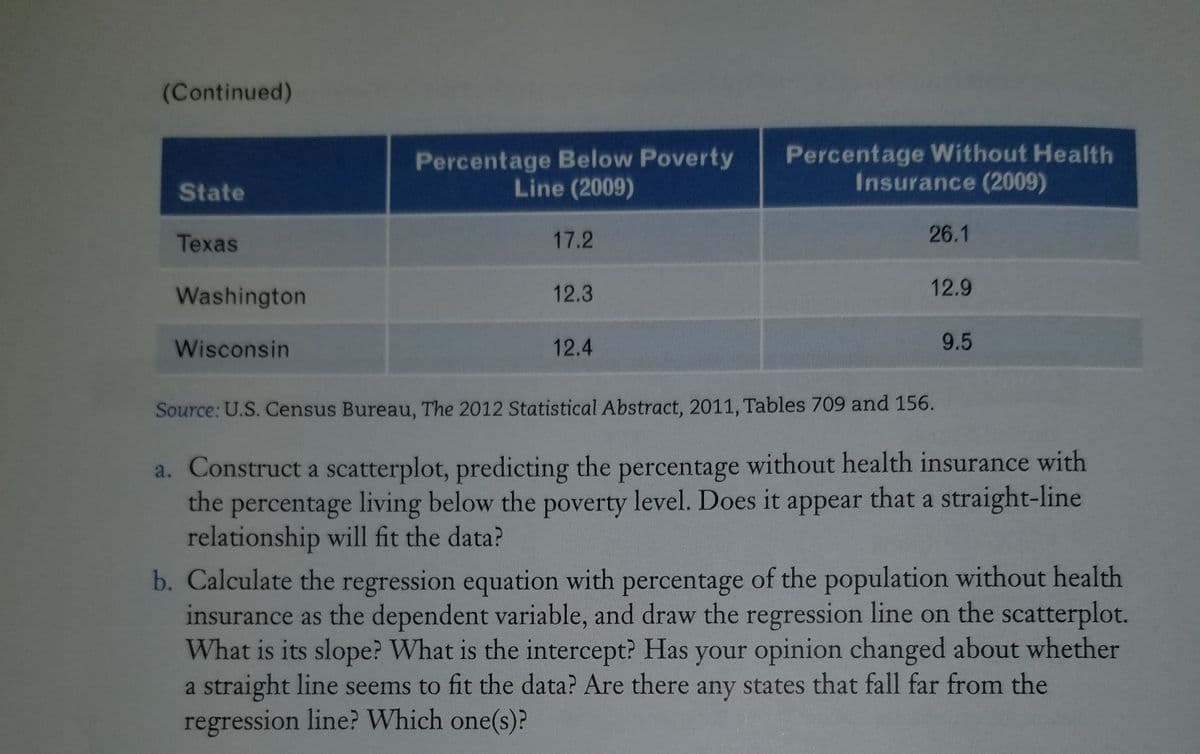
Transcribed Image Text:(Continued)
Percentage Below Poverty
Line (2009)
Percentage Without Health
Insurance (2009)
State
Texas
17.2
26.1
Washington
12.3
12.9
Wisconsin
12.4
9.5
Source: U.S. Census Bureau, The 2012 Statistical Abstract, 2011, Tables 709 and 156.
a. Construct a scatterplot, predicting the percentage without health insurance with
the percentage living below the poverty level. Does it appear that a straight-line
relationship will fit the data?
b. Calculate the regression equation with percentage of the population without health
insurance as the dependent variable, and draw the regression line on the scatterplot.
What is its slope? What is the intercept? Has your opinion changed about whether
a straight line seems to fit the data? Are there any states that fall far from the
regression line? Which one(s)?
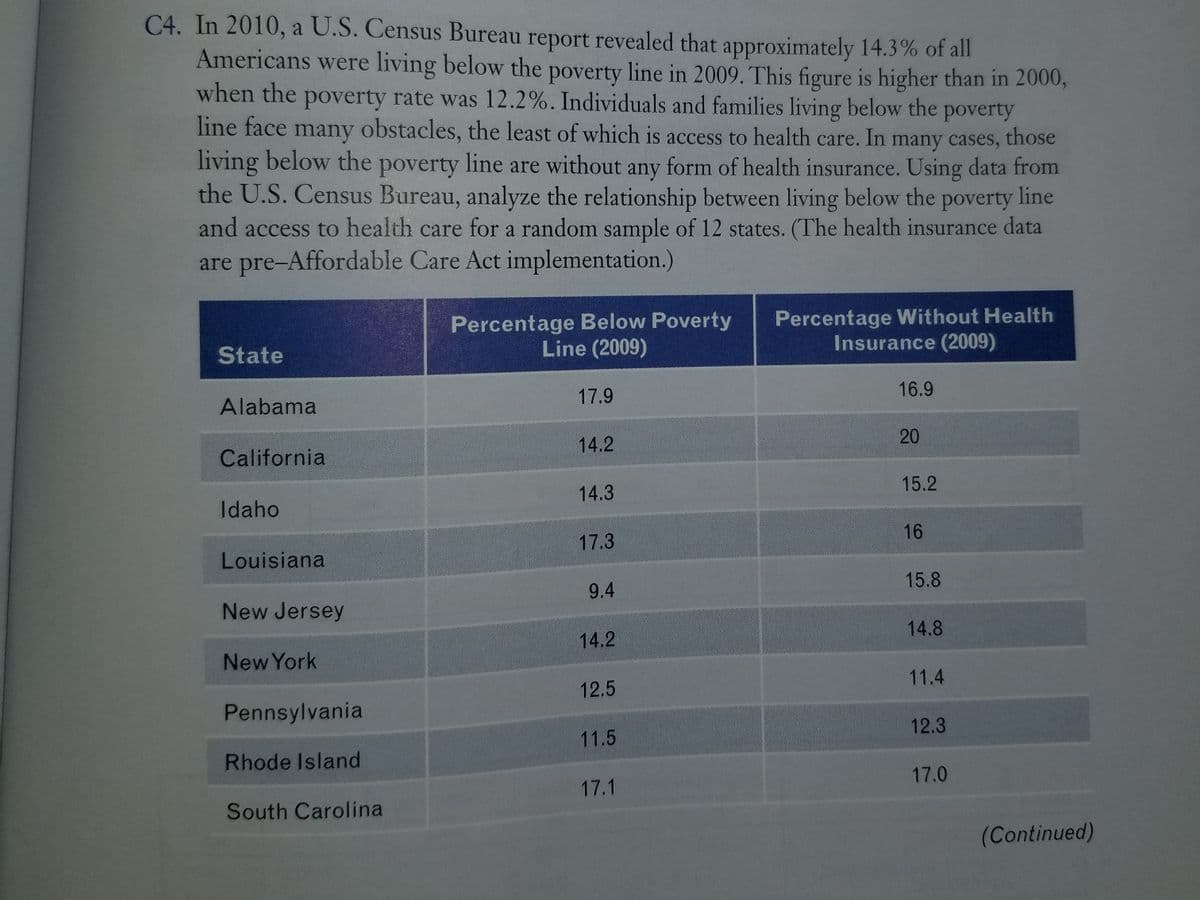
Transcribed Image Text:C4. In 2010, a U.S. Census Bureau report revealed that approximately 14.3% of all
Americans were living below the poverty line in 2009. This figure is higher than in 2000,
when the poverty rate was l12.2%. Individuals and families living below the poverty
line face many obstacles, the least of which is access to health care. In
living below the poverty line are without any form of health insurance. Using data from
the U.S. Census Bureau, analyze the relationship between living below the poverty line
and access to health care for a random sample of 12 states. (The health insurance data
are pre-Affordable Care Act implementation.)
many cases, those
Percentage Below Poverty
Line (2009)
Percentage Without Health
Insurance (2009)
State
17.9
16.9
Alabama
14.2
20
California
15.2
14.3
Idaho
16
17.3
Louisiana
15.8
9.4
New Jersey
14.8
14.2
New York
11.4
12.5
Pennsylvania
12.3
11.5
Rhode Island
17.0
17.1
South Carolina
(Continued)
Expert Solution
This question has been solved!
Explore an expertly crafted, step-by-step solution for a thorough understanding of key concepts.

This is a popular solution!

Trending now
This is a popular solution!

Step by step
Solved in 4 steps with 3 images

Recommended textbooks for you

Glencoe Algebra 1, Student Edition, 9780079039897…
Algebra
ISBN:
9780079039897
Author:
Carter
Publisher:
McGraw Hill

Big Ideas Math A Bridge To Success Algebra 1: Stu…
Algebra
ISBN:
9781680331141
Author:
HOUGHTON MIFFLIN HARCOURT
Publisher:
Houghton Mifflin Harcourt
Glencoe Algebra 1, Student Edition, 9780079039897…
Algebra
ISBN:
9780079039897
Author:
Carter
Publisher:
McGraw Hill
Big Ideas Math A Bridge To Success Algebra 1: Stu…
Algebra
ISBN:
9781680331141
Author:
HOUGHTON MIFFLIN HARCOURT
Publisher:
Houghton Mifflin Harcourt

Algebra for College Students
Algebra
ISBN:
9781285195780
Author:
Jerome E. Kaufmann, Karen L. Schwitters
Publisher:
Cengage Learning

Intermediate Algebra
Algebra
ISBN:
9781285195728
Author:
Jerome E. Kaufmann, Karen L. Schwitters
Publisher:
Cengage Learning