Calculate the arithmetic mean, variance, and the coefficient of variation for the given data: Marks 31-35 36-40 41-45 46-50 51-55 56-60 61-65 Obtained Number of 5 12 25 30 25 12 5 students
Calculate the arithmetic mean, variance, and the coefficient of variation for the given data: Marks 31-35 36-40 41-45 46-50 51-55 56-60 61-65 Obtained Number of 5 12 25 30 25 12 5 students

Glencoe Algebra 1, Student Edition, 9780079039897, 0079039898, 2018
18th Edition
ISBN:9780079039897
Author:Carter
Publisher:Carter
Chapter10: Statistics
Section10.5: Comparing Sets Of Data
Problem 14PPS

Related questions
Question
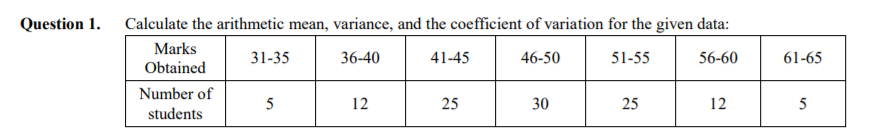
Transcribed Image Text:Question 1. Calculate the arithmetic mean, variance, and the coefficient of variation for the given data:
Marks
31-35
36-40
41-45
46-50
51-55
56-60
61-65
Obtained
Number of
5
12
25
30
25
12
5
students
Expert Solution
This question has been solved!
Explore an expertly crafted, step-by-step solution for a thorough understanding of key concepts.

Step by step
Solved in 2 steps

Recommended textbooks for you
Glencoe Algebra 1, Student Edition, 9780079039897…
Algebra
ISBN:
9780079039897
Author:
Carter
Publisher:
McGraw Hill
Glencoe Algebra 1, Student Edition, 9780079039897…
Algebra
ISBN:
9780079039897
Author:
Carter
Publisher:
McGraw Hill