Calculate the test statistic (t-value) and degrees of freedom for a hypothesis test for the differences of paired data (dependent samples) Question A political analyst believes that a senator's recent decision to support a bill resulted in a drop of approval ratings. To test this claim, he selects random cities in the state that voted the senator in and compares the approval ratings before the decision to the approval ratings after the decision. If we let d = approval rating after - approval rating before, based on the data below, what are the test statistic and degrees of freedom of an appropriate hypothesis test? Assume that the approval ratings are normally distributed. Round the test statistic to three decimal places. Approval Rating After (percent) Approval Rating Before (percent) 58.9 56.2 54.7 52.1 52.1 49.6 50.2 49.3 54.3 54.1 48.6 50.7 61.2 54.7 49.6 46.1 Provide your answer below:
Calculate the test statistic (t-value) and degrees of freedom for a hypothesis test for the differences of paired data (dependent samples) Question A political analyst believes that a senator's recent decision to support a bill resulted in a drop of approval ratings. To test this claim, he selects random cities in the state that voted the senator in and compares the approval ratings before the decision to the approval ratings after the decision. If we let d = approval rating after - approval rating before, based on the data below, what are the test statistic and degrees of freedom of an appropriate hypothesis test? Assume that the approval ratings are normally distributed. Round the test statistic to three decimal places. Approval Rating After (percent) Approval Rating Before (percent) 58.9 56.2 54.7 52.1 52.1 49.6 50.2 49.3 54.3 54.1 48.6 50.7 61.2 54.7 49.6 46.1 Provide your answer below:

Glencoe Algebra 1, Student Edition, 9780079039897, 0079039898, 2018
18th Edition
ISBN:9780079039897
Author:Carter
Publisher:Carter
Chapter10: Statistics
Section10.5: Comparing Sets Of Data
Problem 3BGP

Related questions
Question
What is
t=
df =
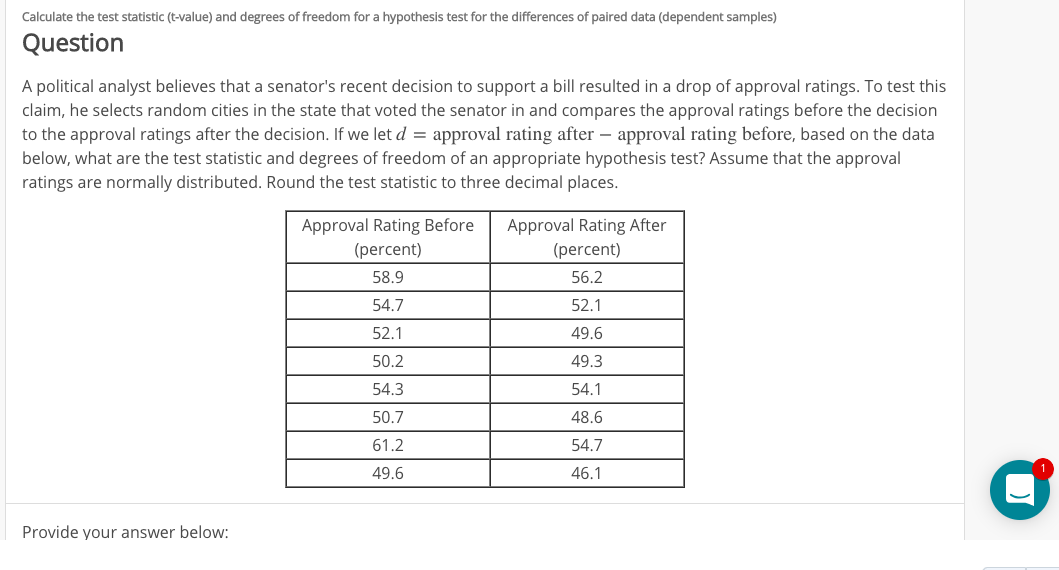
Transcribed Image Text:Calculate the test statistic (t-value) and degrees of freedom for a hypothesis test for the differences of paired data (dependent samples)
Question
A political analyst believes that a senator's recent decision to support a bill resulted in a drop of approval ratings. To test this
claim, he selects random cities in the state that voted the senator in and compares the approval ratings before the decision
to the approval ratings after the decision. If we let d = approval rating after - approval rating before, based on the data
below, what are the test statistic and degrees of freedom of an appropriate hypothesis test? Assume that the approval
ratings are normally distributed. Round the test statistic to three decimal places.
Approval Rating After
(percent)
Approval Rating Before
(percent)
58.9
56.2
54.7
52.1
52.1
49.6
50.2
49.3
54.3
54.1
48.6
50.7
61.2
54.7
49.6
46.1
Provide your answer below:
Expert Solution
This question has been solved!
Explore an expertly crafted, step-by-step solution for a thorough understanding of key concepts.

This is a popular solution!

Trending now
This is a popular solution!

Step by step
Solved in 3 steps with 1 images

Knowledge Booster


Learn more about
Need a deep-dive on the concept behind this application? Look no further. Learn more about this topic, statistics and related others by exploring similar questions and additional content below.Recommended textbooks for you
Glencoe Algebra 1, Student Edition, 9780079039897…
Algebra
ISBN:
9780079039897
Author:
Carter
Publisher:
McGraw Hill
Glencoe Algebra 1, Student Edition, 9780079039897…
Algebra
ISBN:
9780079039897
Author:
Carter
Publisher:
McGraw Hill