Case D - Your company has been selling the following furniture products: Furniture Sales Product Sofas Loveseats Chairs Ottomans Beds in 2019 $86,070 121,492 153,098 42,449 63,208 56,294 31,648 you figure Sales in 2020 $93,402 129,627 96,304 33,608 85,966 67,201 55,023 you figure Dressers Tables ΤΟTALS Prepare a table of ALL of the above information, including totals at the bottom of each column which is measured in dollars: 1. Sorted alphabetically by product (then print the information) 2. Sorted from highest to lowest based on sules in 2020 (then print the information). Prepare the following charts: 3. With the list sorted alphabetically and the amounts in dollars (from part 1), prepare a clustered column chart of the 2019 sales and 2020 sales shown side by side for each product. Please format this chart so that the dollar amount appears at the top of each column in the chart, With the list sorted from highest to lowest based on sales in 2020 (from purt 2), prepare a pie chart of the 2020 sales with the amounts for cach product shown in percentages of the total for the year, rather than dollars. 4.
Case D - Your company has been selling the following furniture products: Furniture Sales Product Sofas Loveseats Chairs Ottomans Beds in 2019 $86,070 121,492 153,098 42,449 63,208 56,294 31,648 you figure Sales in 2020 $93,402 129,627 96,304 33,608 85,966 67,201 55,023 you figure Dressers Tables ΤΟTALS Prepare a table of ALL of the above information, including totals at the bottom of each column which is measured in dollars: 1. Sorted alphabetically by product (then print the information) 2. Sorted from highest to lowest based on sules in 2020 (then print the information). Prepare the following charts: 3. With the list sorted alphabetically and the amounts in dollars (from part 1), prepare a clustered column chart of the 2019 sales and 2020 sales shown side by side for each product. Please format this chart so that the dollar amount appears at the top of each column in the chart, With the list sorted from highest to lowest based on sales in 2020 (from purt 2), prepare a pie chart of the 2020 sales with the amounts for cach product shown in percentages of the total for the year, rather than dollars. 4.

Practical Management Science
6th Edition
ISBN:9781337406659
Author:WINSTON, Wayne L.
Publisher:WINSTON, Wayne L.
Chapter7: Nonlinear Optimization Models
Section: Chapter Questions
Problem 66P

Related questions
Question
100%
Need help with Case D. Thank You
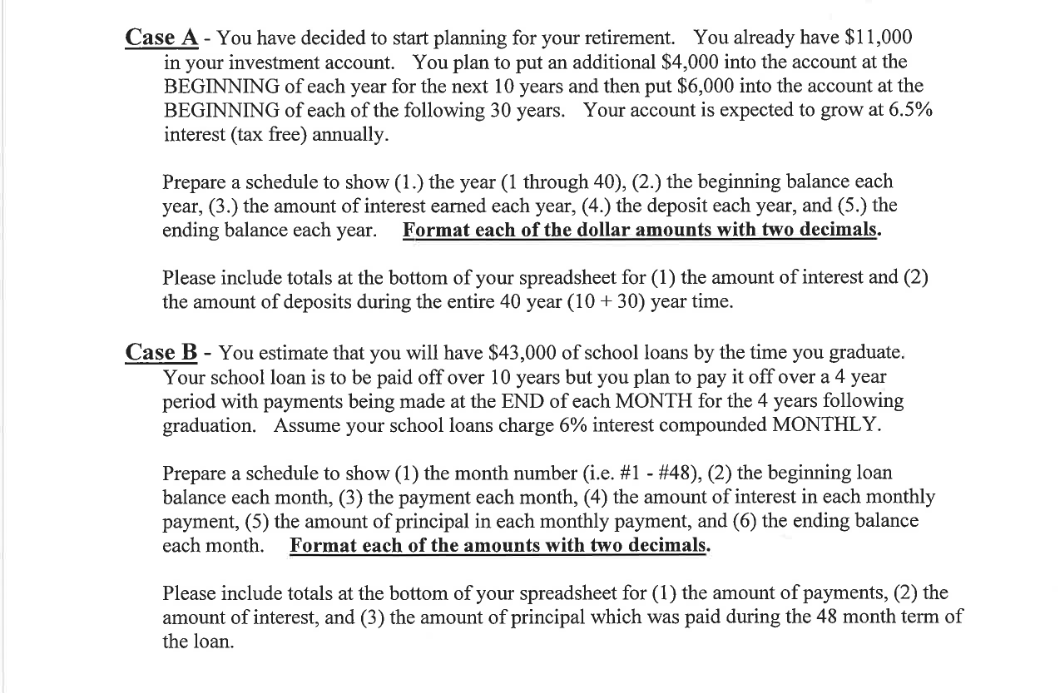
Transcribed Image Text:Case A - You have decided to start planning for your retirement. You already have $11,000
in your investment account. You plan to put an additional $4,000 into the account at the
BEGINNING of each year for the next 10 years and then put $6,000 into the account at the
BEGINNING of each of the following 30 years. Your account is expected to grow at 6.5%
interest (tax free) annually.
Prepare a schedule to show (1.) the year (1 through 40), (2.) the beginning balance each
year, (3.) the amount of interest earned each year, (4.) the deposit each year, and (5.) the
ending balance each year.
Format each of the dollar amounts with two decimals.
Please include totals at the bottom of your spreadsheet for (1) the amount of interest and (2)
the amount of deposits during the entire 40 year (10 + 30) year time.
Case B - You estimate that you will have $43,000 of school loans by the time you graduate.
Your school loan is to be paid off over 10 years but you plan to pay it off over a 4 year
period with payments being made at the END of each MONTH for the 4 years following
graduation. Assume your school loans charge 6% interest compounded MONTHLY.
Prepare a schedule to show (1) the month number (i.e. #1 - #48), (2) the beginning loan
balance each month, (3) the payment each month, (4) the amount of interest in each monthly
payment, (5) the amount of principal in each monthly payment, and (6) the ending balance
each month.
Format each of the amounts with two decimals.
Please include totals at the bottom of your spreadsheet for (1) the amount of payments, (2) the
amount of interest, and (3) the amount of principal which was paid during the 48 month term of
the loan.
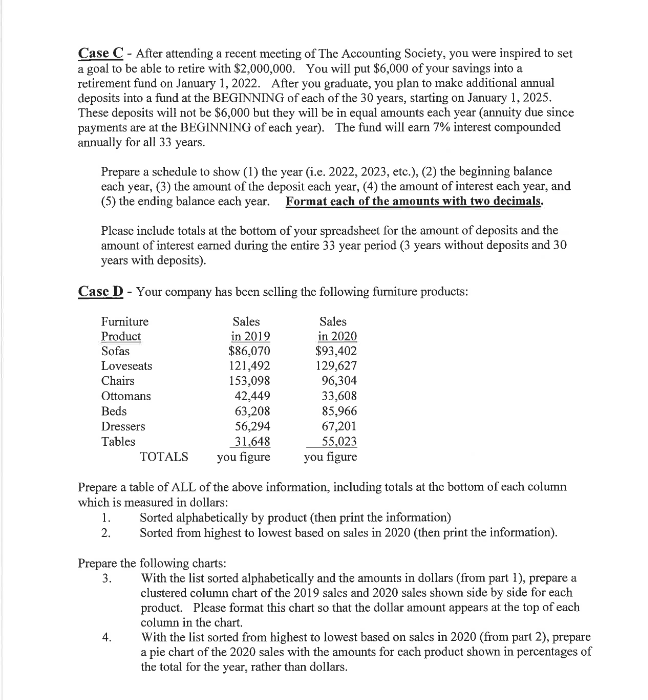
Transcribed Image Text:Case C - After attending a recent meeting of The Accounting Society, you were inspired to set
a goal to be able to retire with $2,000,000. You will put $6,000 of your savings into a
retirement fund on January 1, 2022. After you graduate, you plan to make additional annual
deposits into a fund at the BEGINNING of each of the 30 years, starting on January 1, 2025.
These deposits will not be $6,000 but they will be in equal amounts each year (annuity due since
payments are at the BEGINNING of each year). The fund will earn 7% interest compounded
annually for all 33 years.
Prepare a schedule to show (1) the year (i.e. 2022, 2023, etc.), (2) the beginning balance
each year, (3) the amount of the deposit each year, (4) the amount of interest each year, and
(5) the ending balance each year. Format each of the amounts with two decimals.
Please include totals at the bottom of your spreadsheet for the amount of deposits and the
amount of interest earned during the entire 33 year period (3 years without deposits and 30
years with deposits).
Case D - Your company has been selling the following furniture products:
Furniture
Product
Sofas
Sales
in 2019
$86,070
121,492
153,098
42,449
63,208
56,294
31.648
you figure
Sales
in 2020
$93,402
129,627
96,304
33,608
85,966
67,201
55,023
you figure
Lovescats
Chairs
Ottomans
Beds
Dressers
Tables
ТОTALS
Prepare a table of ALL of the above information, including totals at the bottom of each column
which is measured in dollars:
Sorted alphabetically by product (then print the information)
Sorted from highest to lowest based on sales in 2020 (then print the information).
1.
2.
Prepare the following charts:
With the list sorted alphabetically and the amounts in dollars (from part 1), prepare a
clustered column chart of the 2019 salces and 2020 sales shown side by side for each
product. Please format this chart so that the dollar amount appears at the top of each
column in the chart.
With the list sorted from highest to lowest based on sales in 2020 (from part 2), prepare
a pie chart of the 2020 sales with the amounts for cach product shown in percentages of
the total for the year, rather than dollars.
3.
4.
Expert Solution
This question has been solved!
Explore an expertly crafted, step-by-step solution for a thorough understanding of key concepts.

This is a popular solution!

Trending now
This is a popular solution!

Step by step
Solved in 2 steps with 9 images

Recommended textbooks for you
Practical Management Science
Operations Management
ISBN:
9781337406659
Author:
WINSTON, Wayne L.
Publisher:
Cengage,
Practical Management Science
Operations Management
ISBN:
9781337406659
Author:
WINSTON, Wayne L.
Publisher:
Cengage,