Chapter 12 Homework https://newconnect.mheducation.com/flow/connect.html N 12 Homework Saved Help Save & Exit Sub Suppose that the aggregate demand and aggregate supply schedules for a hypothetical economy are as shown in the following table: Amount of Real GDP Amount of Real GDP Supplied, Billions Price Level (Price Index) Demanded, Billions $100 300 $450 200 250 400 300 200 300 400 150 200 500 100 100 a. Use the data above to graph the aggregate demand and aggregate supply curves Instructions: (1) Use the tools provided 'AD' and AS' to draw the aggregate demand (plot 5 points total) and aggregate supply curves (plot 5 points total) given in the table above. To earn full credit for this graph. you must plot all required points for each curve. (2) Use the tool provided 'Eq' to indicate the equilibrium price level and the equilibrium level of real output 12 of 16 Next
Chapter 12 Homework https://newconnect.mheducation.com/flow/connect.html N 12 Homework Saved Help Save & Exit Sub Suppose that the aggregate demand and aggregate supply schedules for a hypothetical economy are as shown in the following table: Amount of Real GDP Amount of Real GDP Supplied, Billions Price Level (Price Index) Demanded, Billions $100 300 $450 200 250 400 300 200 300 400 150 200 500 100 100 a. Use the data above to graph the aggregate demand and aggregate supply curves Instructions: (1) Use the tools provided 'AD' and AS' to draw the aggregate demand (plot 5 points total) and aggregate supply curves (plot 5 points total) given in the table above. To earn full credit for this graph. you must plot all required points for each curve. (2) Use the tool provided 'Eq' to indicate the equilibrium price level and the equilibrium level of real output 12 of 16 Next

Chapter20: Aggregate Demand And Supply
Section: Chapter Questions
Problem 7SQP

Related questions
Question
Instructions: Enter your answers as whole numbers.
A) What are the
Is the equilibrium real output also necessarily the full-employment real output?
B)If the price level in this economy is 150, will quantity demanded equal, exceed, or fall short of quantity supplied? By what amount?
If the price level is 250, will quantity demanded equal, exceed, or fall short of quantity supplied? By what amount?
C) Suppose that buyers desire to purchase $ 200 billion of extra real output at each price level. What are the new equilibrium price level and level of real output?
Transcribed Image Text:Chapter 12 Homework
https://newconnect.mheducation.com/flow/connect.html
N
12 Homework
Saved
Help
Save & Exit
Sub
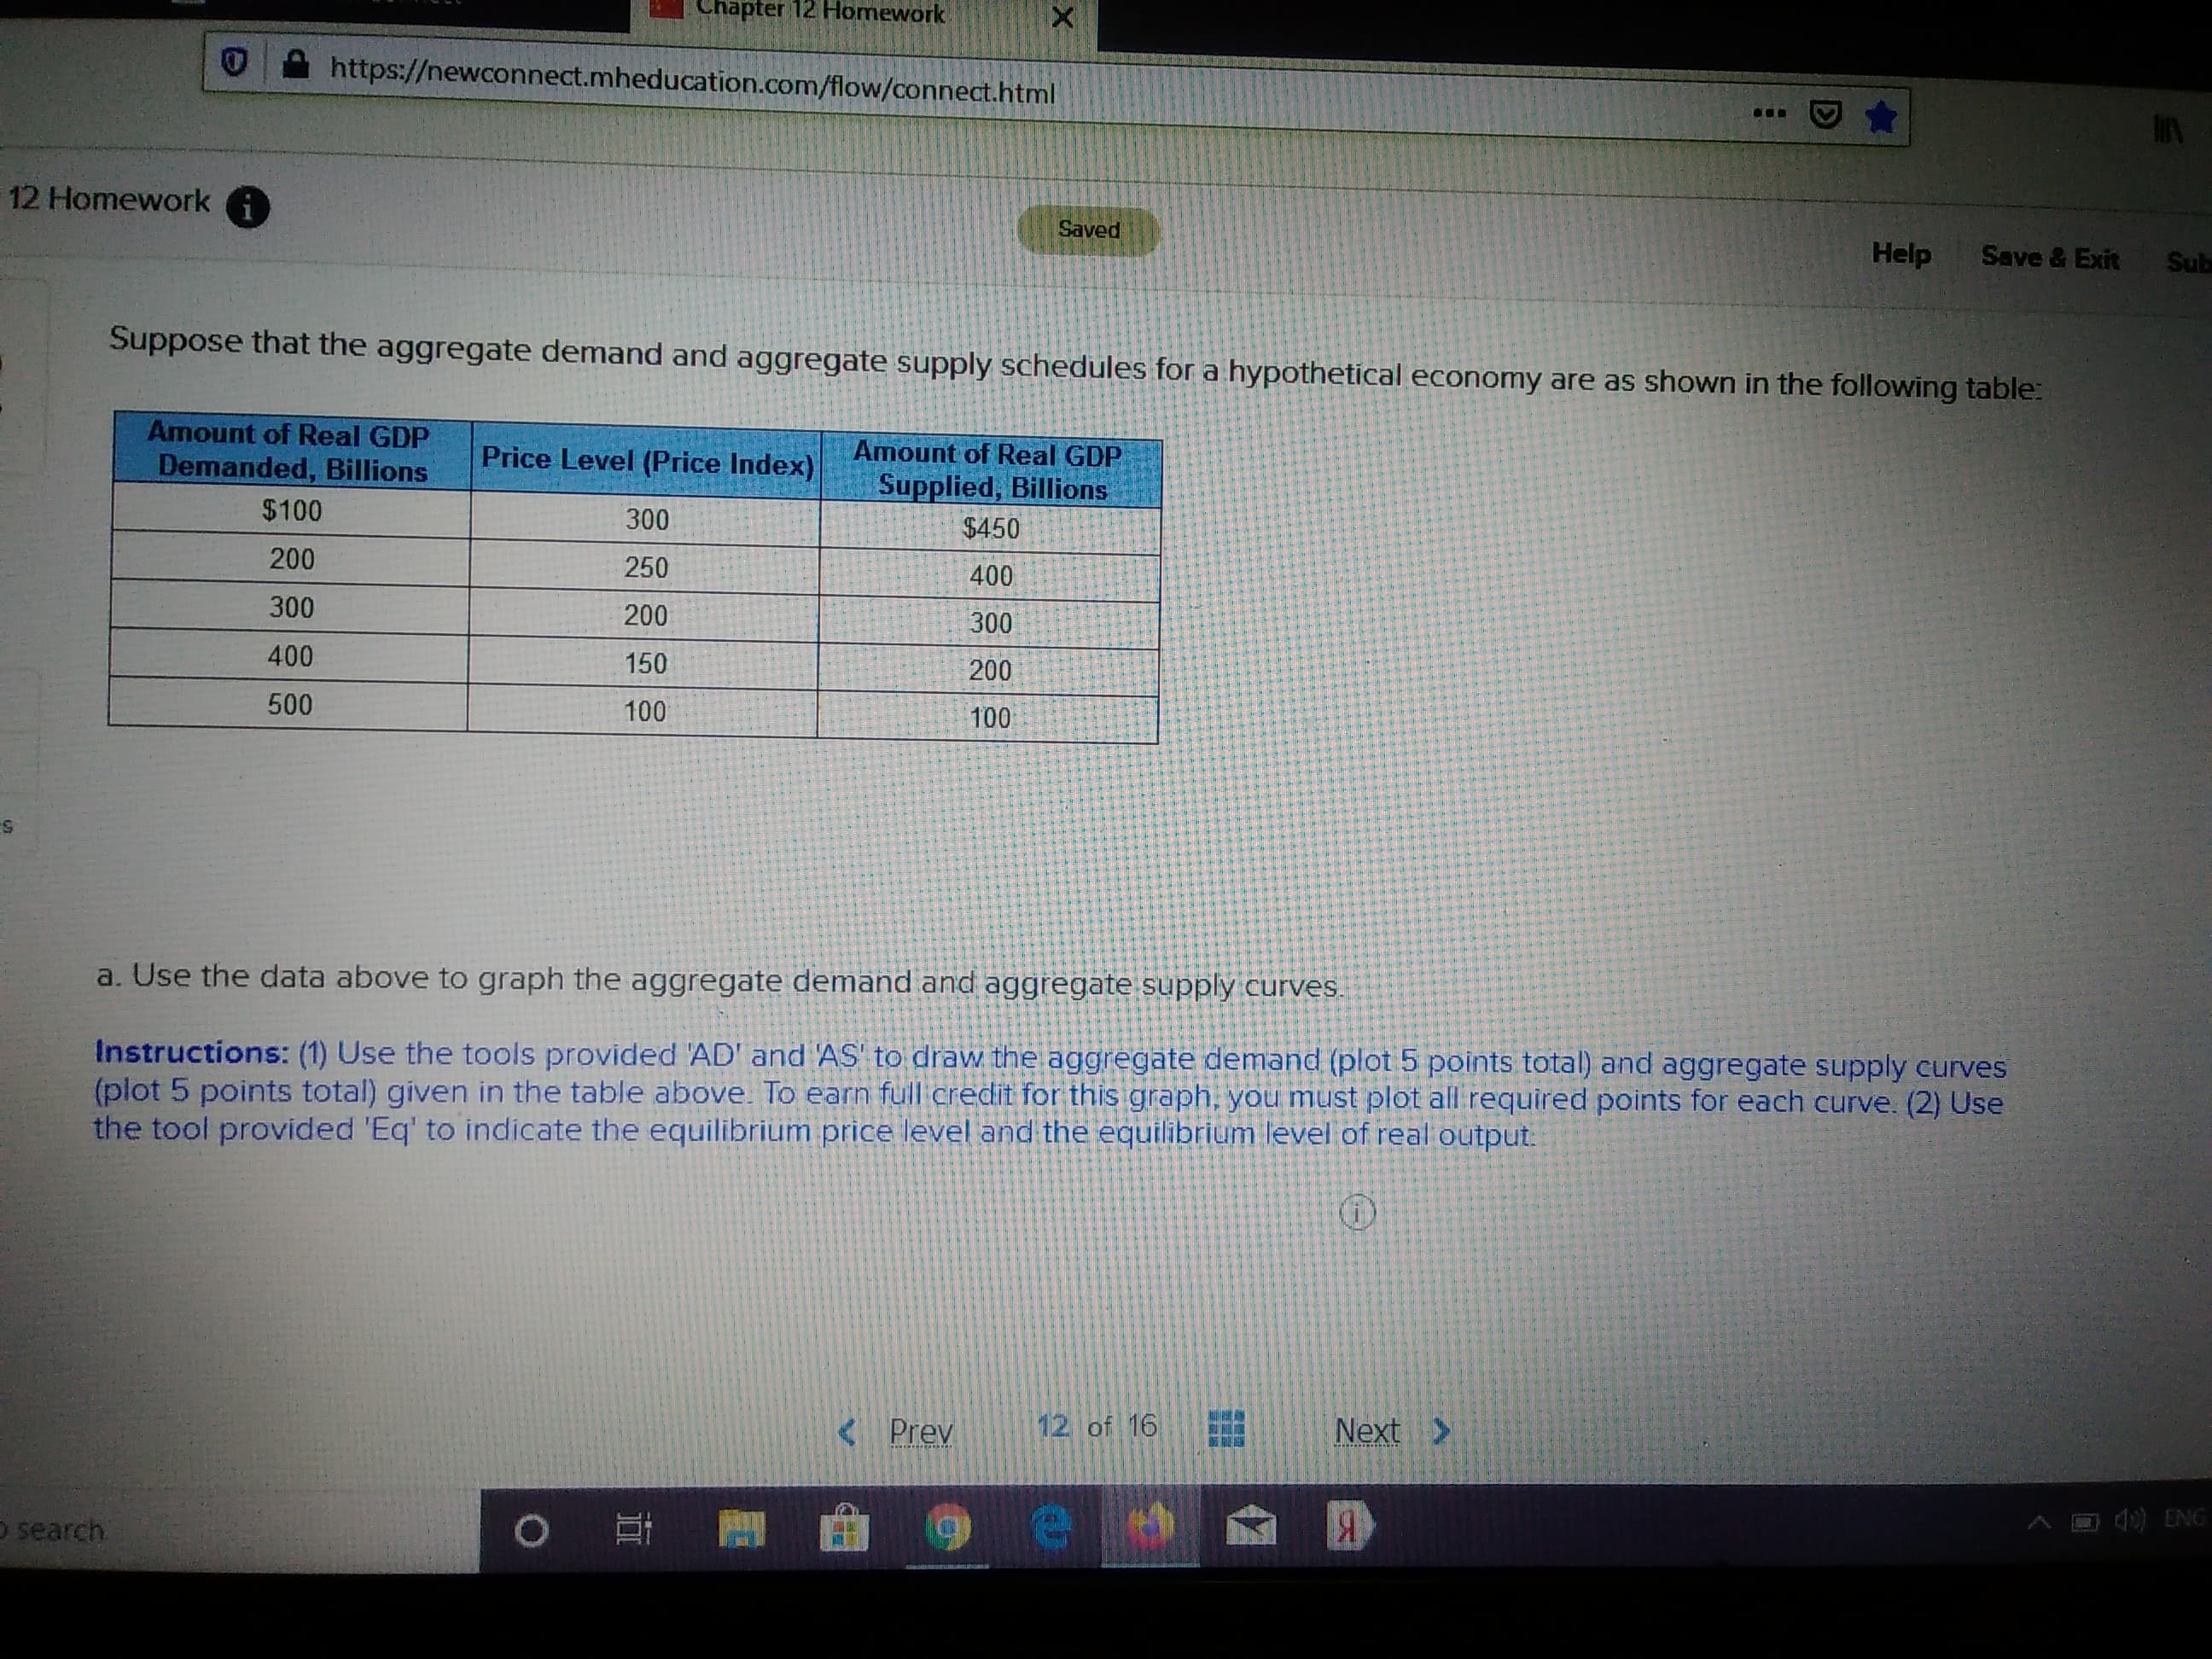
Suppose that the aggregate demand and aggregate supply schedules for a hypothetical economy are as shown in the following table:
Amount of Real GDP
Amount of Real GDP
Supplied, Billions
Price Level (Price Index)
Demanded, Billions
$100
300
$450
200
250
400
300
200
300
400
150
200
500
100
100
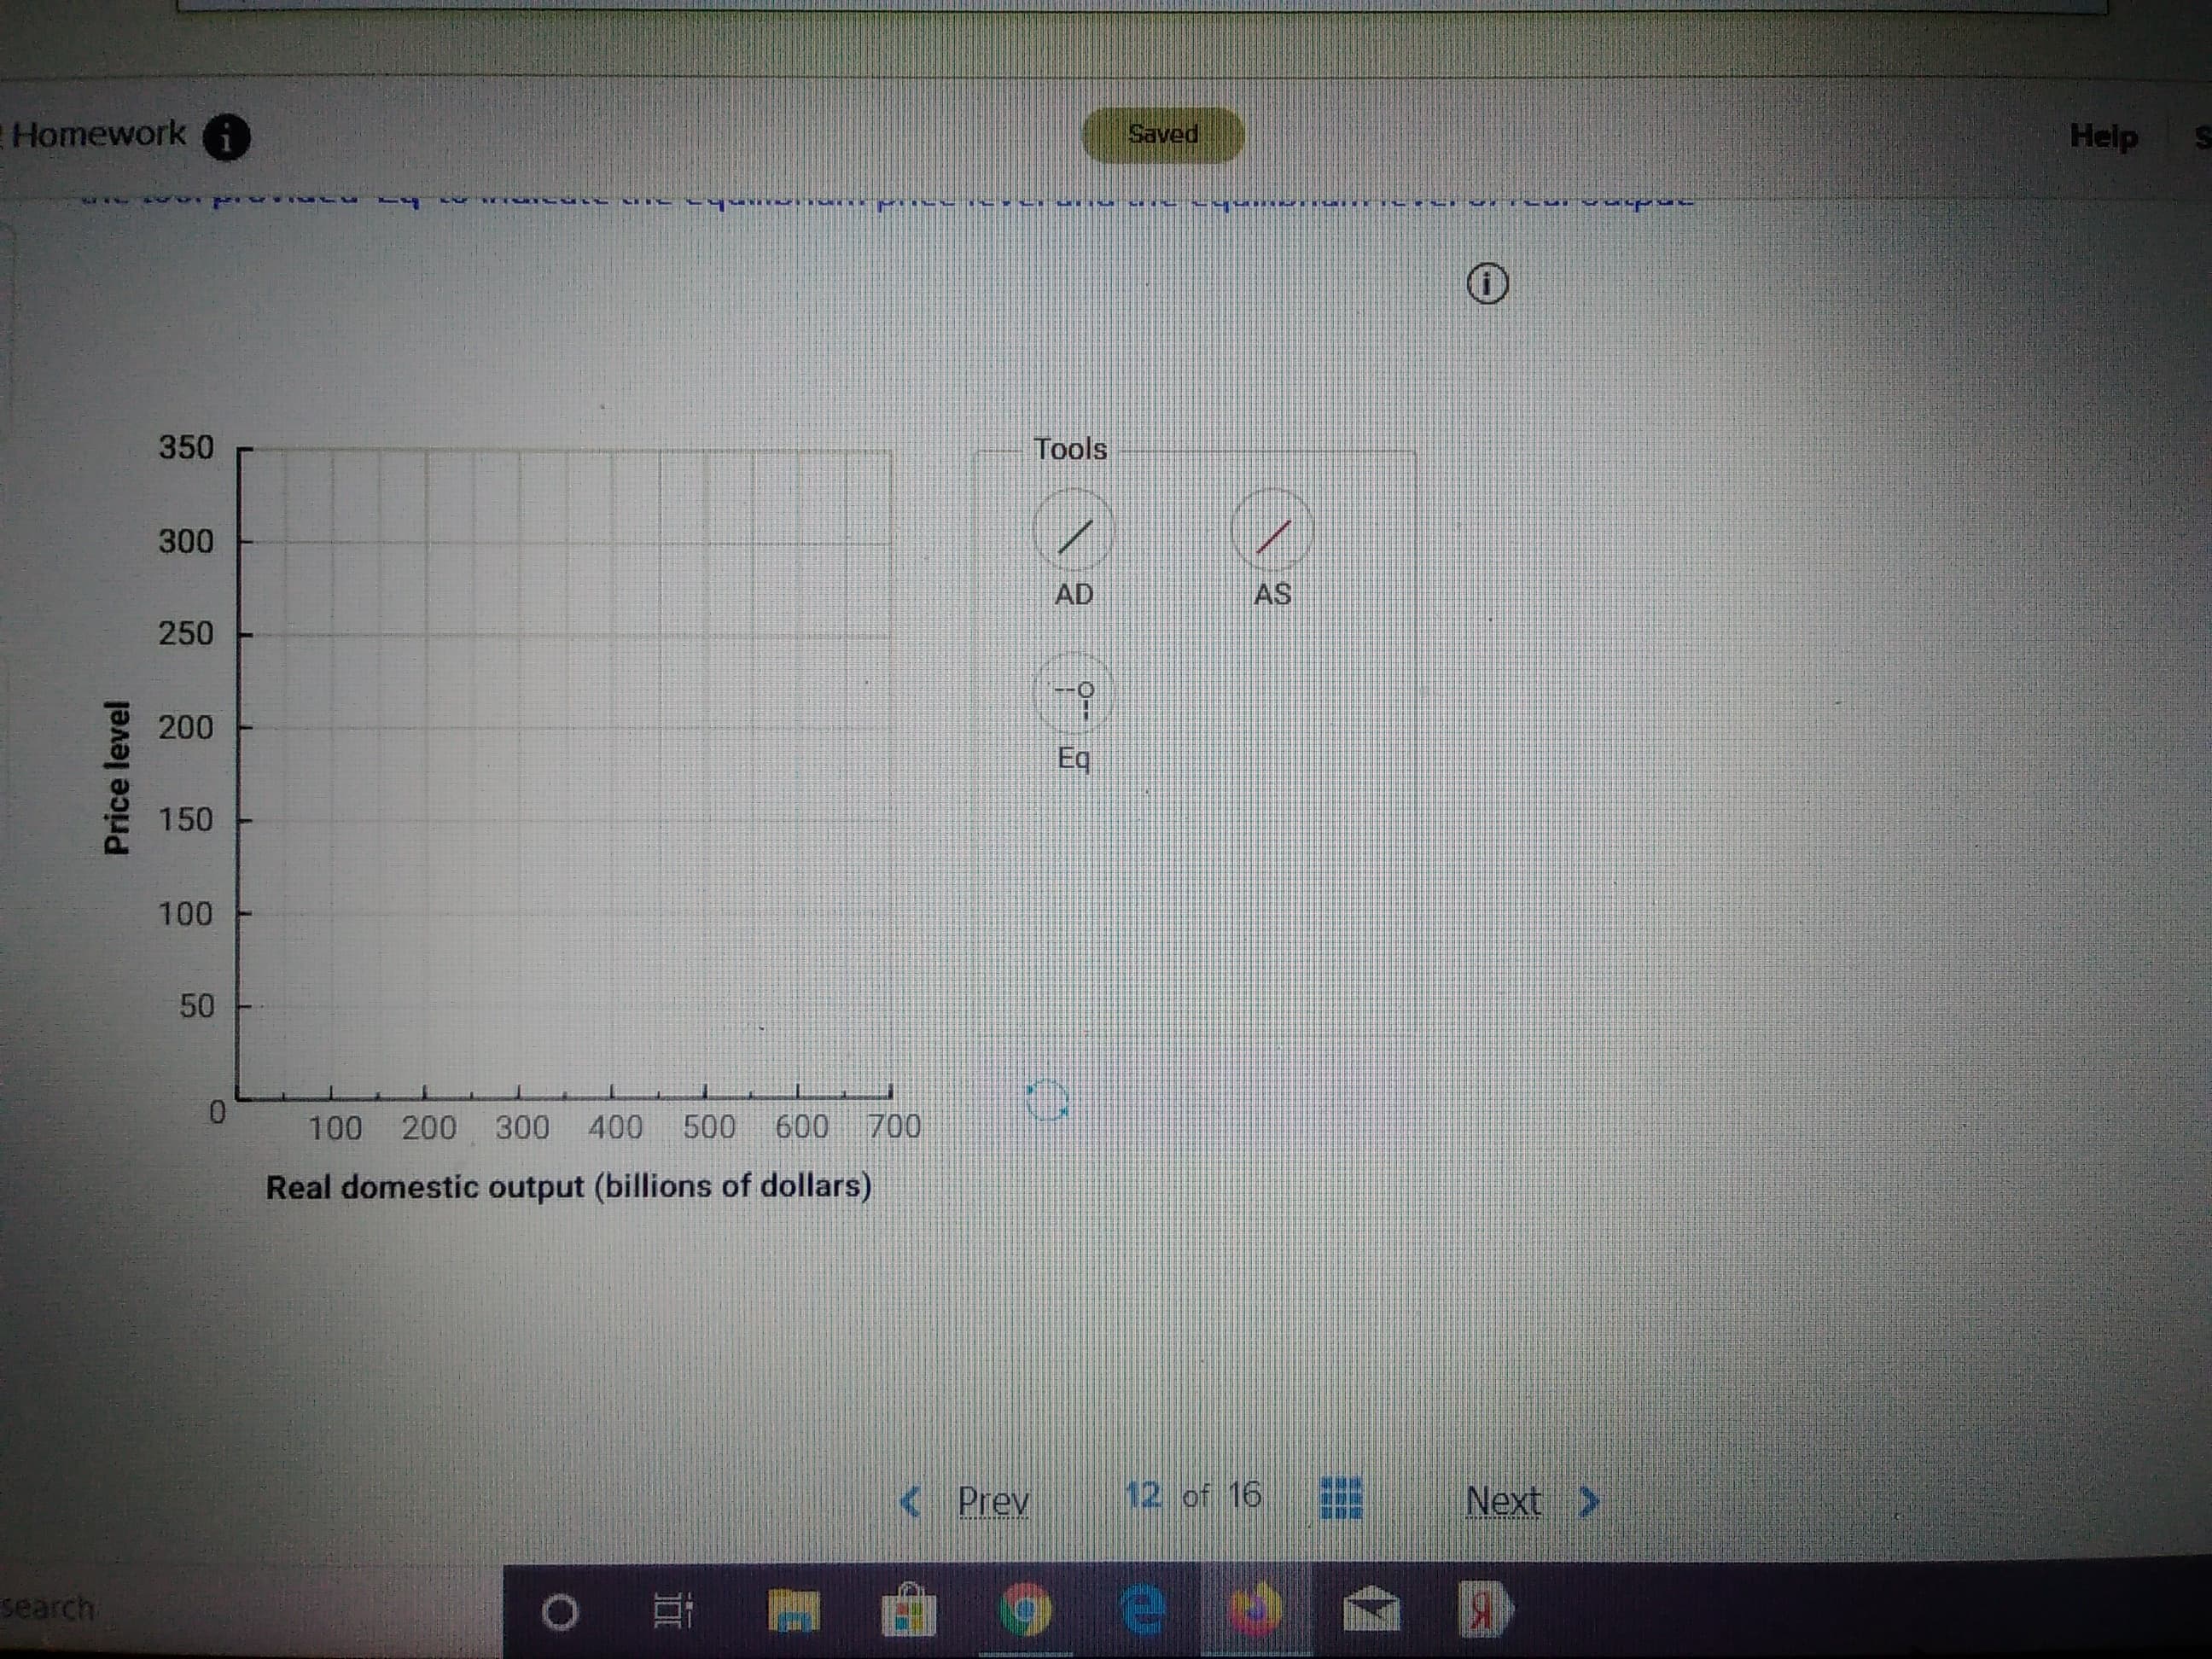
a. Use the data above to graph the aggregate demand and aggregate supply curves
Instructions: (1) Use the tools provided 'AD' and AS' to draw the aggregate demand (plot 5 points total) and aggregate supply curves
(plot 5 points total) given in the table above. To earn full credit for this graph. you must plot all required points for each curve. (2) Use
the tool provided 'Eq' to indicate the equilibrium price level and the equilibrium level of real output
12 of 16
Next
<Prev
ENG
O
search
Transcribed Image Text:Homework
Help
Saved
350
Tools
300
AS
AD
250
200
Eq
150
100
50
600
700
500
100
200
300 400
Real domestic output (billions of dollars)
12 of 16
KPrev
Next
e
search
O
Price level
Expert Solution
This question has been solved!
Explore an expertly crafted, step-by-step solution for a thorough understanding of key concepts.

This is a popular solution!

Trending now
This is a popular solution!

Step by step
Solved in 3 steps with 2 images

Knowledge Booster


Learn more about
Need a deep-dive on the concept behind this application? Look no further. Learn more about this topic, economics and related others by exploring similar questions and additional content below.Recommended textbooks for you


Macroeconomics: Private and Public Choice (MindTa…
Economics
ISBN:
9781305506756
Author:
James D. Gwartney, Richard L. Stroup, Russell S. Sobel, David A. Macpherson
Publisher:
Cengage Learning
Macroeconomics: Private and Public Choice (MindTa…
Economics
ISBN:
9781305506756
Author:
James D. Gwartney, Richard L. Stroup, Russell S. Sobel, David A. Macpherson
Publisher:
Cengage Learning

Economics: Private and Public Choice (MindTap Cou…
Economics
ISBN:
9781305506725
Author:
James D. Gwartney, Richard L. Stroup, Russell S. Sobel, David A. Macpherson
Publisher:
Cengage Learning

