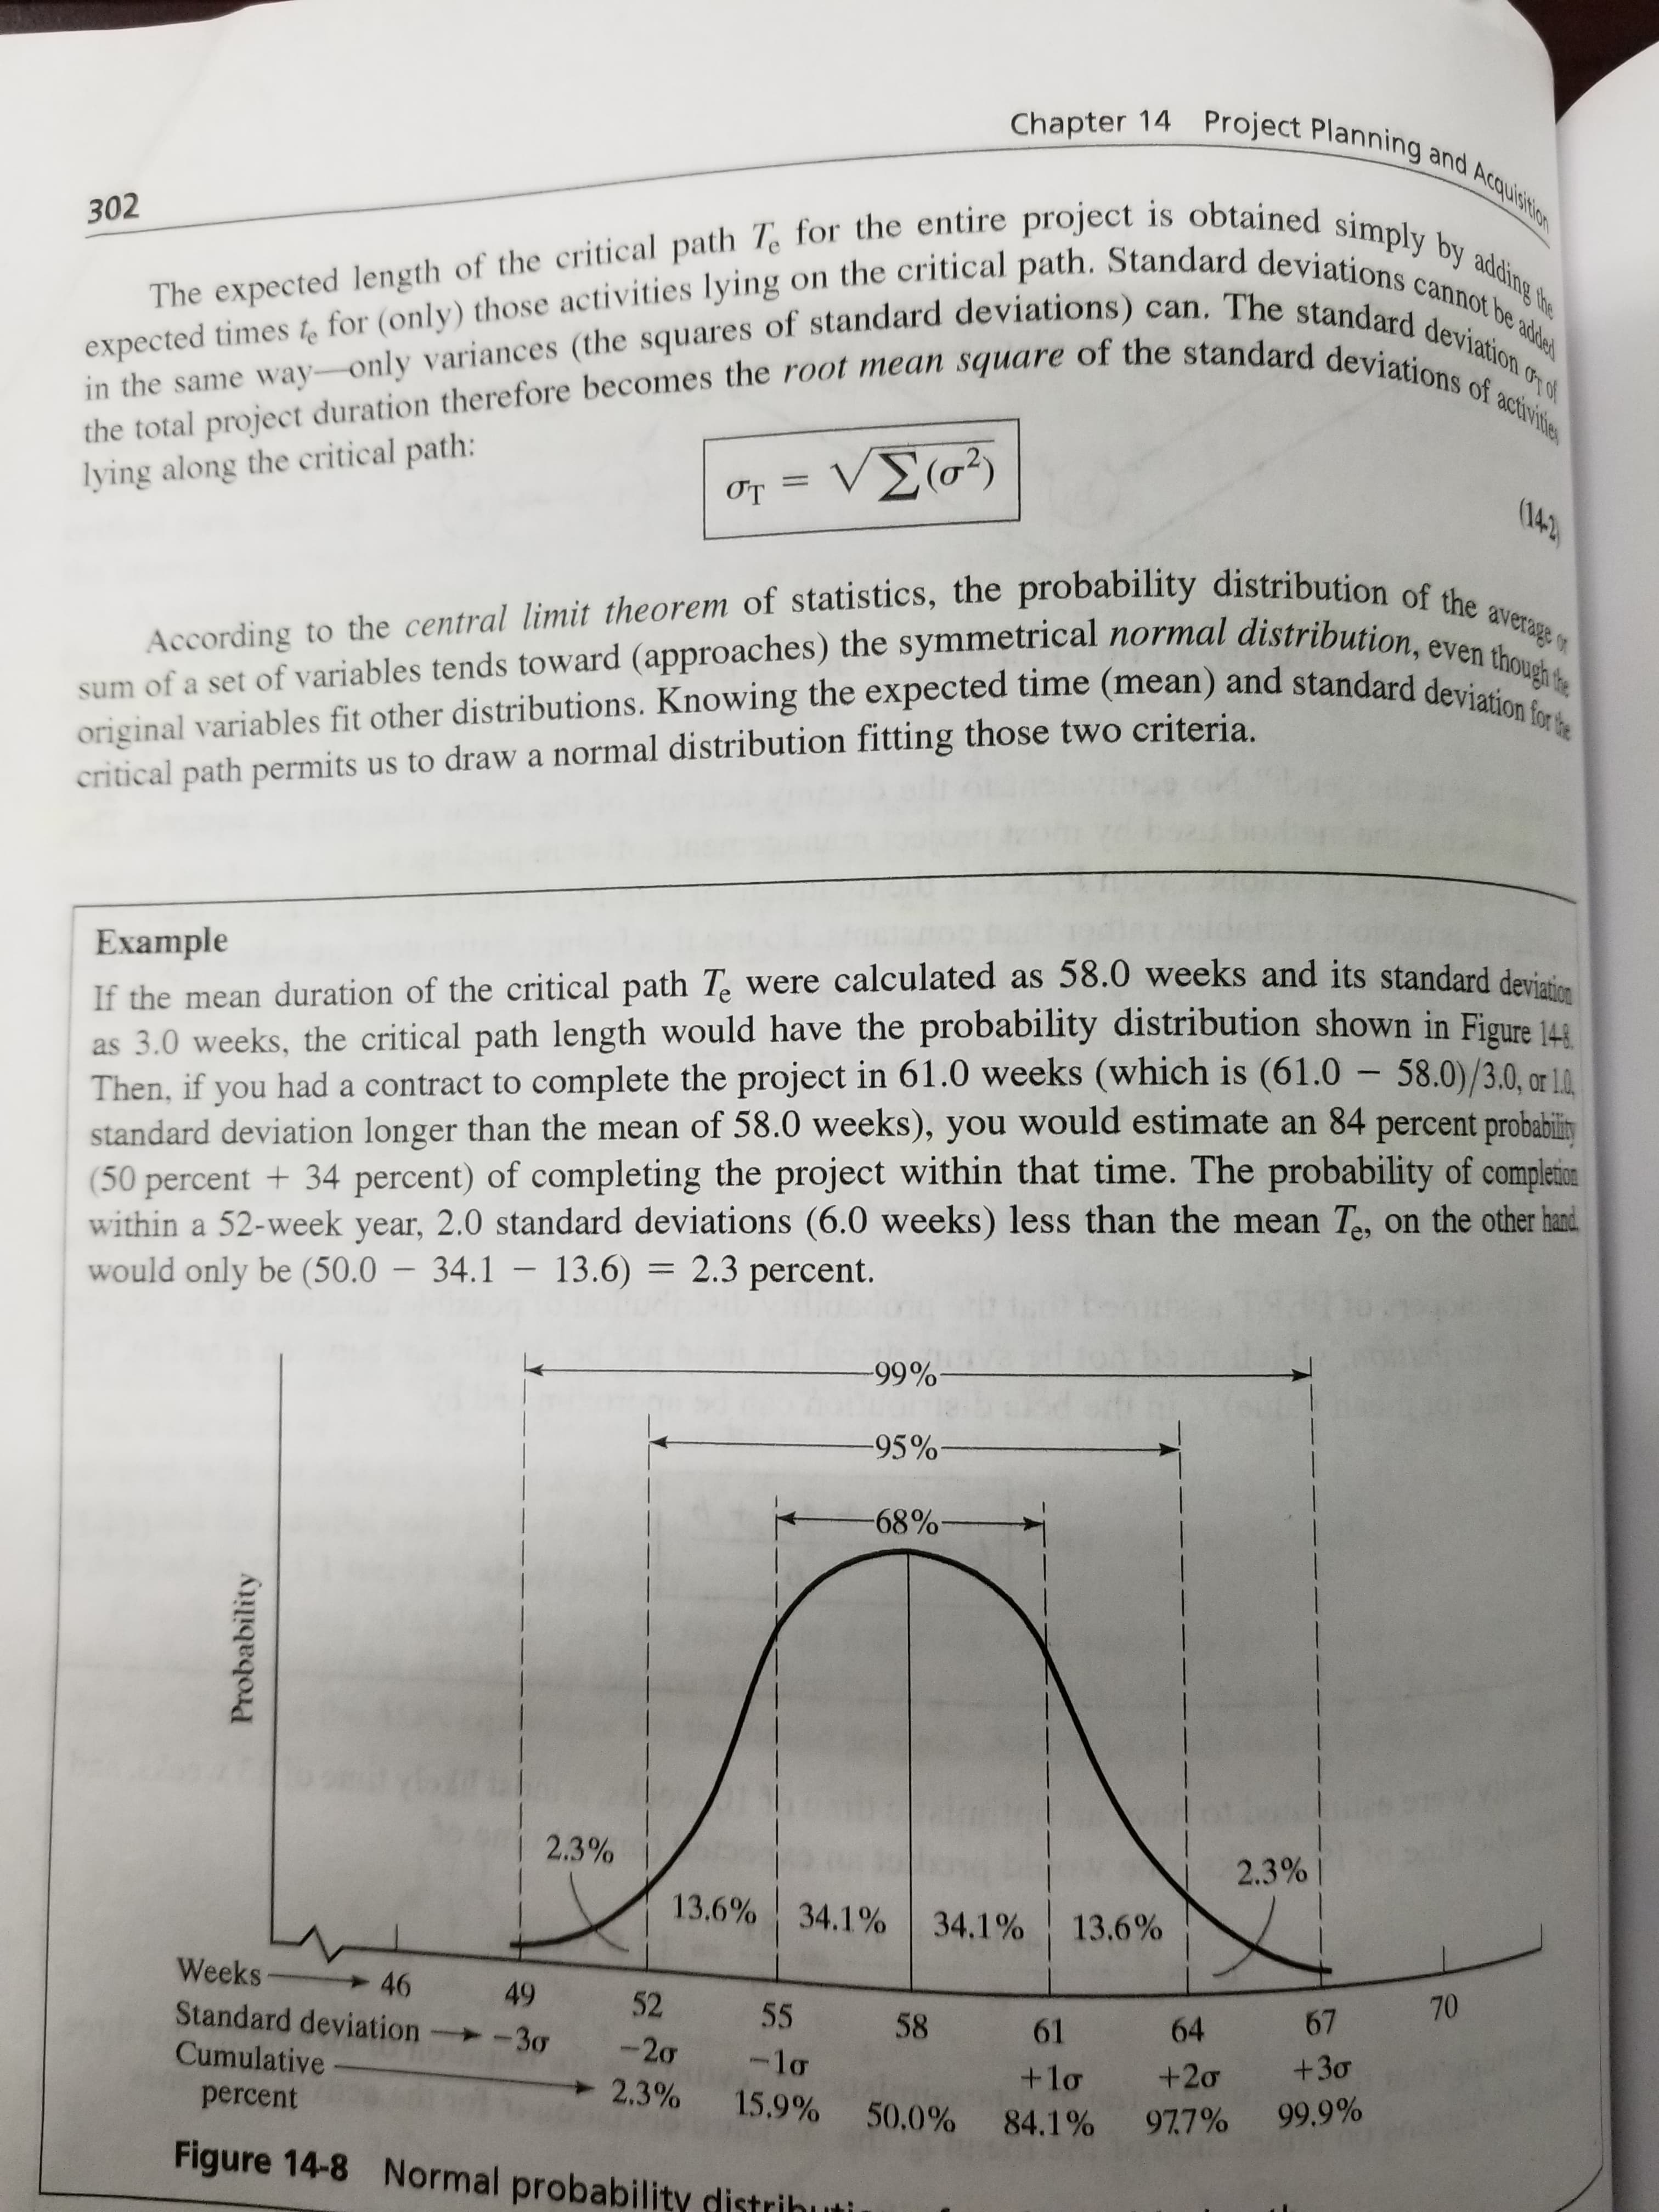
Chapter 14 Project Planning and Acquishtion The expected length of the critical path T. for the entire project is obtained simply by adding fhe 302 expected times t, for (only) those activities lying on the critical path. Standard deviations cannot be adlel the total project duration therefore becomes the root mean square of the standard deviations of activities νΣσ) in the same way-only variances (the squares of standard deviations) can. The standard deviationC lying along the critical path: (14-2 OT average on According to the central limit theorem of statistics, the probability distribution ec though te sum of a set of variables tends toward (approaches) the symmetrical normal distribution, even t original variables fit other distributions. Knowing the expected time (mean) and standard deviation for te critical path permits us to draw a normal distribution fitting those two criteria. If the mean duration of the critical path Te were calculated as 58.0 weeks and its standard deviet as 3.0 weeks, the critical path length would have the probability distribution shown in Figure 144 Then, if you had a contract to complete the project in 61.0 weeks (which is (61.0 – 58.0)/3.0. or 1. standard deviation longer than the mean of 58.0 weeks), you would estimate an 84 percent probabilin (50 percent + 34 percent) of completing the project within that time. The probability of complein within a 52-week year, 2.0 standard deviations (6.0 weeks) less than the mean Te, on the other hand would only be (50.0 – 34.1 – 13.6) = 2.3 percent. Example -99%- -95%- 68%* | 2.3% 2.3% | 13.6% 34.1% 34.1% 13.6% Weeks 70 46 Standard deviation 49 52 55 58 61 64 67 -30 -20 -lo +20 +30 Cumulative +lo 2.3% 15.9% 50.0% 84.1% 977% 99.9% percent Figure 14-8 Normal probability distrihur Probability


Continuous Probability Distributions
Probability distributions are of two types, which are continuous probability distributions and discrete probability distributions. A continuous probability distribution contains an infinite number of values. For example, if time is infinite: you could count from 0 to a trillion seconds, billion seconds, so on indefinitely. A discrete probability distribution consists of only a countable set of possible values.
Normal Distribution
Suppose we had to design a bathroom weighing scale, how would we decide what should be the range of the weighing machine? Would we take the highest recorded human weight in history and use that as the upper limit for our weighing scale? This may not be a great idea as the sensitivity of the scale would get reduced if the range is too large. At the same time, if we keep the upper limit too low, it may not be usable for a large percentage of the population!
If a project has an expected time of completion Te of 45 weeks witha standard deviation of 7 weeks, what is the probability of completing it (a) within one year (52 weeks)? (b) within 38 weeks.


Trending now
This is a popular solution!

Step by step
Solved in 3 steps with 3 images


