
Microeconomics: Principles & Policy
14th Edition
ISBN: 9781337794992
Author: William J. Baumol, Alan S. Blinder, John L. Solow
Publisher: Cengage Learning
expand_more
expand_more
format_list_bulleted
Question
Hello, I would like help in this graph.
Thanks

Transcribed Image Text:Chapter Problem 1
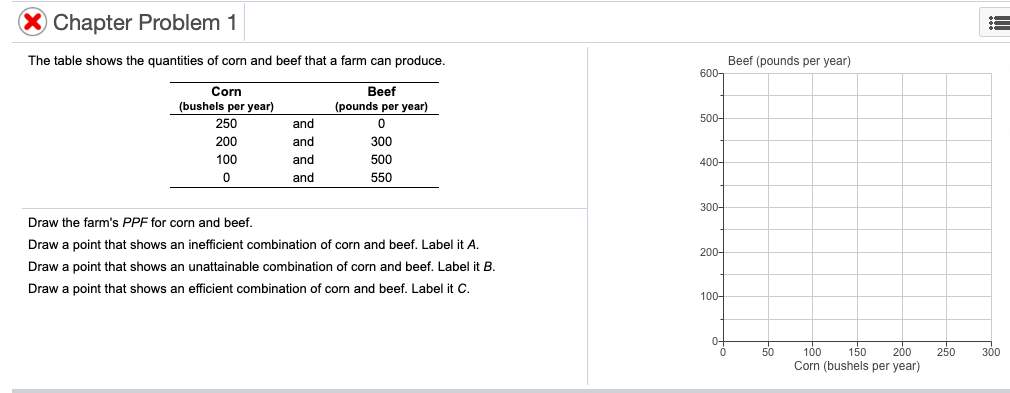
The table shows the quantities of corn and beef that a farm can produce.
Beef (pounds per year)
600-
Corn
Beef
(pounds per year)
(bushels per year)
500-
250
and
200
300
and
100
500
and
400-
and
550
300-
Draw the farm's PPF for corn and beef.
Draw a point that shows an inefficient combination of corn and beef. Label it A.
200
Draw a point that shows an unattainable combination of corn and beef. Label it B.
Draw a point that shows an efficient combination of corn and beef. Label it C.
100-
0-
100
250
150
Corn (bushels per year)
200
300
50
Expert Solution

Trending nowThis is a popular solution!
Step by stepSolved in 4 steps with 1 images

Knowledge Booster
Learn more about
Need a deep-dive on the concept behind this application? Look no further. Learn more about this topic, economics and related others by exploring similar questions and additional content below.Similar questions
Imagine a country XYZ that produces only two goods—chairs and tables. Together, the chairs and tablesindustries use all of the economy’s factors of production. The table below shows the productionpossibilities for XYZ:Production Possibilities for XYZChairs Tables600 0450 150300 250150 325 0 375a. Draw a Production Possibility Frontier for the country using the information in tableabove.
b. What is the opportunity cost of increasing chairs production from 450 chairs to 600chairs?c. What is the opportunity cost of increasing tables production from 250 tables to 325tables?d. Plot the point denoting 300 chairs and 300 tables on your graph above. Is this point“feasible”? Why or why not?e. Plot the point denoting 300 chairs and 50 tables on your graph above. Should XYZ beproducing at this point? Why or why not?
arrow_forward
Suppose a nation has a total of 12 units of labor, which can be used to produce either guns orbutter. One gun takes 6 units of labor to produce and 1 butter takes 2 units of labor toproduce.Evaluate the allocation of resources of this country based on the following points.• Reason for the scarcity that exists in this economy. Use the data as evidence of yourreasoning.• Maximum quantity of guns that can be produced.• Maximum quantity of butter than can be produced.• Diagram which represents the nation’s production possibility curve.• Opportunity cost of guns in this nation• Reason why the nation can’t produce both 3 guns and 4 butters.• Reason why the nation shouldn’t produce both 1 gun and 2 butters.
arrow_forward
Wichita — Farmers in Kansas, the biggest US producerof wheat, are abandoning their crops damaged by severedrought and cold.Some are spraying wheat fields with crop-killingchemicals and claiming insurance payouts in the beliefthat it is not worth harvesting the little grain that thereis, Reuters found on a three-day tour of the state. Othergrowers let cattle graze on the dismal-looking fields.Abandoning fields will reduce the crop of the world’sfifth-largest wheat exporter, with stocks expected to fallto a 16-year low. Large-scale abandonment deals aneconomic blow to farm towns and force wheat buyersto adjust procurement plans by buying the staple grainelsewhere.Nationally, winter-wheat farmers plan to abandon 33%of the acres they planted, the highest percentage sinceWorld War 1, the US department of agriculture said ina May 12 report.Kansas farmers are expected to abandon about 19% ofthe area planted last autumn, up from 10% in 2022 and4% in 2021, according to the report. But farmers,…
arrow_forward
listen to this The Economist, Adam ruins everything video, and a few other articles about using a market to help animal conservation using trophy hunting. Please write a 1 to 2-page paper about how the program alters how people look at different animals.
Paper requirements:
Size: 11
Font: Calibri
Spacing: Double
Length: 1-2
Paper Questions:
Adam ruins everything: https://youtu.be/cQh-f1rBjx4
The Economist: https://youtu.be/9y7YFjisSTg
Vice article: Link
Questions you must answer, you may write a standard paper, or you can answer the following questions in bullet point form. You must write it in an easy-to-read form regardless of how you choose to do it.
What is trophy hunting? Is trophy hunting the main reason animals are being killed off?
Why is there demand for exotic animal parts? How does this impact animal deaths?
https://www.vice.com/en/article/akgb3a/rare-rhino-horns-worth-78-million-burnt
Please describe how the program works. Walk me through all the steps.
What issues do…
arrow_forward
Graph the PPF
A
B
C
D
E
F
Sanitizer(y)
100
95
85
65
35
0
Rice (x)
0
5
10
15
20
25
Graph the two demand curve and mark Z the point where price is 4 and demand is 20.
Price
0
1
2
3
4
5
Demand (A)
60
50
40
30
20
10
Demand (B)
24
20
16
12
8
4
Graph the demand curve and if the price is 6 please shade the consumer surplus
Price
0
2
4
6
8
10
12
Demand
60
50
40
30
20
10
0
Graph the two supply curve and mark X the point where price is 6 and supply is 6.
Price
0
2
4
6
8
10
Supply (A)
0
3
6
9
12
15
Supply (B)
0
2
4
6
8
10
Graph the supply curve and if the price is 3 and supply is 9 units please shade the consumer surplus
Price
0
1
2
3
4
5
Supply (A)
0
3
6
9
12
15
Graph the demand and supply curve. Mark Z the equilibrium point…
arrow_forward
POSSIBILITIES PINEAPPLES MANGOESA 100 0B 90 15C 70 30D 40 45E 0 60
1. Graph the production possibility frontier (PPF) placing pineapples on the X axis and mangoes on the Y axis. 2. On PPF curve drawn, identify the following points:
i. Unattainable (label the point U)
ii. Attainable and efficient (label the point AE)
iii. Attainable and inefficient (label the point AI)
3. What does the shape of the PPF curve drawn suggest about the opportunity cost of producing ONE more unit of pineapples or mangoes
4. If mangoes harvesting increases from 15 to 30, what is the opportunity cost of harvesting pineapples?
5. What is the economic significance of choosing to harvest at 25 pineapples and 50 mangoes?
6. With the aid of a diagram, explain the effect of a new technological mobile weather station on…
arrow_forward
Practice Question 8: Resubmitted
Table 1
James
Lucy
Wagons
16
18
Tricycles
32
24
Table 1 shows the output per week of two people, James and Lucy. They can either devote their time to making wagons or making tricycles.
What is Lucy's opportunity cost of making a wagon?
Group of answer choices
1. 1 1/3 tricycles
2. 2 tricycles
3. 3/4 of a wagon
4. 3 wagons
arrow_forward
Imagine a country XYZ that produces only two goods—chairs and tables. Together, the chairs and tablesindustries use all of the economy’s factors of production. The table below shows the productionpossibilities for XYZ:Production Possibilities for XYZChairs Tables600 0450 150300 250150 325 0 375
use the slope (rise/run) to solve it and describe what happen
a. What is the opportunity cost of increasing chairs production from 450 chairs to 600chairs?
b. What is the opportunity cost of increasing tables production from 250 tables to 325tables?
arrow_forward
-A) Describe production and the factors that go into producing various goods and services.
-B) Describe the opportunity cost an economy incurs to increase the production of one product.
Use a production possibilities frontier
arrow_forward
Table 1:Production AlternativeTypes of Prod
PRODUCTION ALTERNATIVES
Types of Production
A
B
C
D
E
CEREAL
0
250
450
650
850
BREAD
130
117
109
89
0
Using the Table 1 abovea. Draw a production possibilities curve for cereal and bread using the data above. b. Label the points where the economy would be efficient (A), underutilized (B) and unattainable (C).
arrow_forward
DATA RESPONSE QUESTION ON PRODUCTION POSSIBILITY FRONTER (PPF)
Consider the following data for the harvest of pineapples versus the harvest of mangoes in Jamaica.
JAMAICA’S FARM
POSSIBILITIES
PINEAPPLES
MANGOES
A
100
0
B
90
15
C
70
30
D
40
45
E
0
60
a. Graph the production possibility frontier (PPF) placing pineapples on the X axis and mangoes on the Y axis.
b. On PPF curve drawn, identify the following points:
a. Unattainable (label the point U)
b. Attainable and efficient (label the point AE)
c. Attainable and inefficient (label the point AI)
c. What does the shape of the PPF curve drawn suggest about the opportunity cost of producing ONE more unit of pineapples or mangoes
d. If mangoes harvesting increases from 15 to 30, what is the opportunity cost of harvesting pineapples?
e. What is the economic significance of choosing to harvest at 25 pineapples and 50 mangoes?
f. Explain the effect of a hurricane on…
arrow_forward
arrow_back_ios
SEE MORE QUESTIONS
arrow_forward_ios
Recommended textbooks for you

Microeconomics: Principles & Policy
Economics
ISBN:9781337794992
Author:William J. Baumol, Alan S. Blinder, John L. Solow
Publisher:Cengage Learning

Essentials of Economics (MindTap Course List)
Economics
ISBN:9781337091992
Author:N. Gregory Mankiw
Publisher:Cengage Learning

Brief Principles of Macroeconomics (MindTap Cours...
Economics
ISBN:9781337091985
Author:N. Gregory Mankiw
Publisher:Cengage Learning