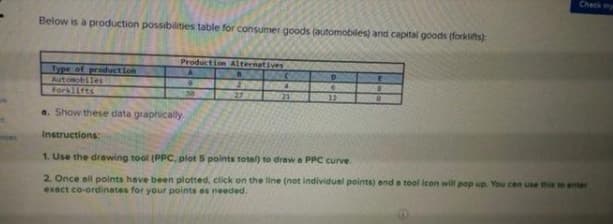
Check my Below is a production possibilities table for consumer goods (automobiles) and capital goods (forkifts) Production Alternatives Type of production Autoobiles Forklifts 27 रै 12 a. Show these data graphically Instructions: 1. Use the drawing tool (PPC, plot 5 points total) to draw e PPC curve. 2. Once all points have been plotted, click on the line (not individual points) end a tool icon will pop up. You cen use this to enter exact co-ordinates for your points es needed.


Q: Table 1: Production Capacity of COVID-FREE LAND.Toilet Rolls Sanitizers30,000 028,000 1,00024,000…
A: An economy has a given amount of resources that it has to employ in the most efficient manner. In…
Q: 140 120 100 40 20 PPF 10 20 30 60 70 Quantity of rubber hoses 40 50 80 90 100 (Figure: Figure:…
A: If Rubberland does not increase its production of rubber horses, but still maximizes its productive…
Q: A production possibilities table for bananas and apples is shown below: Production Alternatives Type…
A: The PPC shows the all-possible combinations of two goods by using its all factors efficiently and…
Q: Use the information in the table below. The economy of Libraryland can produce only books and…
A: Here the opportunity cost is the amount of time spent on production of magazine vs the time spent on…
Q: Figure 3-3 Arturo's Production Possibilities Frontier Dina's Production Possibilities Frontier…
A: The economies tend to use their limited amount of resources in various ways in order to fulfill the…
Q: A production possibilities table for bananas and apples is shown below: Production Alternatives Type…
A: Opportunity cost is the next best option for a producer to gain profit. It is the forgone cost that…
Q: d, both Ana and Dina will benefit from any contributions made by the other person. Sp ll bring each…
A: Contribution margin, or dollar commitment per unit, is the selling cost per unit less the variable…
Q: Gorgeousleny of course as a consumer have so many thing in mind to buy aside from juice. with her…
A: Opportunity cost a good refers to the amount of consumption foregone of other goods in order to…
Q: 5. Opportunity cost and production possibilities Lorenzo is a skilled toy maker who is able to…
A: Production Possibility Frontier represents the different combinations of two goods that can be…
Q: The accompanying hypothetical production possibilities tables are for New Zealand and Spain. Each…
A: Because individuals have limited resources at their disposal, the problem of scarcity requires them…
Q: Graphing: Using the Production Possibilities Schedule above, make a Production Possibilities…
A: "In economics a production possibility frontier represents the different combination of the two…
Q: QUESTION 2: Table 1: Production Capacity of COVID-FREE LAND. Toilet Rolls Sanitizers 30,000 28,000…
A: a) Using the above figures we can draw a PPF (production possibility curve) of COVID free land using…
Q: 6.On a production possibilities frontier, produ ction is efficient if the production point is…
A: A production possibility frontier shows the combinations of two goods that can be produced by using…
Q: Paolo is a skilled toy maker who is able to produce both boats and puzzles. He has 8 hours a day to…
A: A production possibilities frontier characterizes the arrangement of decisions society faces for the…
Q: A production possibilities table for bananas and apples is shown below: Production Alternatives B…
A: Here is the PPC for apples and bananas:
Q: A production possibilities table for DVDS and computers is shown below. Production Alternatives B…
A: The production possibility curve is the curve that shows all the combinations of output that can be…
Q: 3. Change in Relative Price and Trade T-shirts 800 700 600 500 400 300 200 100 100 200 300 400 500…
A: Hi! Thank you for the question, As per the honor code, we are allowed to answer three sub-parts at a…
Q: Alyssa is a skilled toy maker who is able to produce both boats and kites. She has 8 hours a day to…
A: Given:- Hours producing Produced Choice Boats Kites Boats Kites A 8 0 4 0 B 6 2 3 8…
Q: 1. PPF and CPF - Jane and Tarzan can produce food and luxury goods. • Tarzan's production…
A: Opportunity costs address the potential advantages a private, financial backer, or business passes…
Q: The following is a production possibilities table for war goods and civilian goods: Production…
A: Disclaimer :- since you asked multipart question we are solving one the first 3 subparts as per…
Q: Refer to the table. Answer questions on the basis of the data given in the following table. Produc…
A: Opportunity cost: - opportunity cost is a forgone benefit which we could have earned by applying all…
Q: 4. Opportunity cost and production possibilities Cho is a skilled toy maker who is able to produce…
A: Meaning of Opportunity Cost: The term opportunity cost refers to the situation under which the…
Q: omework (Ch 01) Poornima is a skilled toy maker who is able to produce both trains and kitds. She…
A: Poornima is a skilled toy maker who is able to produce both trains and kites. She has 8 hours a day…
Q: uppose an economy produces two goods: food and machines. this economy always operates on its…
A: The "production possibility frontier" (PPF) depicts the various products and services that can be…
Q: a. Suppose that you are on a deserted island and can produce either 32 tons of coconuts OR 16 tons…
A: Answer: Introduction: PPF (production possibility frontier): PPF refers to the curve that shows…
Q: Production Possibilities Schedule Production Scenario Widgets Gizmos A 30 В 28 22 2 D 12 3 E a)…
A: The production possibility frontier (PPF) shows different combination of two inputs which can be…
Q: Refer to the following production possibilities table for consumer goods (automobiles) and capital…
A: Answer a) fixed resources mean there are limited and scarce resources and full employment means all…
Q: Below is a production possibilities table for consumer goods (automobiles) and capital goods…
A:
Q: Sketch a graph to illustarte your idea of each of the following relationships. Be sure to label both…
A: 1. Using more amount of fertilizer may speed-up the growth of corn. Hence, both are expected to have…
Q: Below is a production possibilities table for consumer goods (automobiles) and capital goods…
A: The graphical representation of the table is:
Q: Table Zoom A country has the following production possibilities table: Resources devoted Output of…
A: Increasing marginal opportunity cost implies that the rate of substitution of clothing for food is…
Q: 3. If the economy characterized by this production possibilities table and curve were producing 3…
A: The question talks about PPC which is such a curve that represent possible combination of two goods…
Q: The data below describe the current production possibilities for an economy that produces two goods:…
A: Meaning of Production Possibility Frontier: The term production possibility frontier refers to the…
Q: A tropical creates a shortage in the item needed in the production of goos B. Explain how this would…
A: Production Possibilities Curve (PPC) is the locus of combinations of two goods a nation produces by…
Q: 5. Opportunity cost and production possibilities Juanita is a skilled toy maker who is able to…
A: Given table:
Q: a Explain the economic link between scarcity, choice and opportunity cost.
A: Note: We’ll answer the first question since the exact one wasn’t specified. Please submit a new…
Q: (Shape of the PPF) Suppose a production possibilitiesfrontier includes the following…
A:
Q: 2. Given the following diagram of a production possibilities frontier for a country. Assume that…
A: Production Possibility Frontier shows the combination of two goods that can be produced with the…
Q: During the Second World War, Germany's factories were decimated and fered many human casualties,…
A: The production possibility curve shows the different combinations of two goods that can be produced…
Q: Sam is a skilled toy maker who is able to produce both cars and balls. He has 8 hours a day to…
A: PPF shows different combinations of two goods that can be produced with the given level of resources…
Q: DIRECTION WITH GOOD X Part 11 GOOD X Y QUESTION: DIPT : PLOT THE IN THE HORIZONTAL AXIS Production…
A: Economics refers to the social science that studies the production, distribution, and consumption of…
Q: Question 3 - Part 2 Explain how each of the following situations would affect a nation's production…
A: The PPF curve shows the combinations of goods that a nation can be produced using all of its…
Q: Production Alternatives Type of Production A B D. E Automobiles 4 8. Forklifts 30 27 21 12 a. Show…
A: c) Producing 3 automobiles and 20 forklifts, here it can be said that the resources here are left…
Q: Using the following combinations as Production Possibilities data for consumer goods and capital…
A: In an economy, opportunity cost describes the loss or the amount of output or income that is…
Q: a) Explain exchange efficiency and production efficiency and give the main condition for each type…
A: Exchange efficiency appears with a given combination of goods, it is not possible to redistribute…
Q: e. Which curve(s) could represent the change that would occur with a huge natural disaster that…
A: PPC shows the different combinations of production of two goods at a given level of resources and…
Q: 15 PP PP PP Consumer Goods Refer to the diagram. An improvement in technology will: A. shift the…
A: A PPC (Production Possibility Curve) is a graphical representation of various combinations of output…
Q: Arturo's Production Possibilities Frontier Dina's Production Possibilities Frontier 500 300 400 300…
A: Production possibilities frontier shows the combination of two goods that an economy can produce…
Q: The opportunity cost of writing 1 exam paper for Gary and Evelyn is: (Need help? Read chapter 1.3 of…
A: Opportunity cost is rate of next best alternative. Gary takes 3 hours to complete 1 exam Evelyn…

Step by step
Solved in 2 steps with 1 images

- Why is a production possibilities frontier typically drawn as a curve, rather than a straight line?Explain why societies cannot make a choice above their production possibilities frontier and should not make a choice below it.Would an op-ed piece in a newspaper urging the adoption of a particular economic policy be a positive or normative statement?
- Return to the example in Figure 2.4. Suppose there is an improvement in medical technology that enables more healthcare wilt line same amount of resources. How would this affect the production possibilities curve and, in particular, how would it affect the opportunity cost of education? Figure 2.4 Productive and Allocative EfficiencyBelow is the production possibilities table for consumer goods (maize) and capital goods (tractors):Type of productionProduction possibilities A B C D Emaize 30 27 21 12 0Tractors 0 2 4 6 8i. Show these data graphically. ii. If the economy is at point C, what is the cost of one more unit of maize? iii. Suppose improvement occurs in the technology of producing tractors but not in the technology of producing maize. Draw the new production possibilities curve. iv. Now assume that a technological advance occurs in producing maize but not in producing tractors. Draw the new production possibilities curve. v. Now draw a production possibilities curve that reflects technological improvement in the production of both goods.The data below describe the current production possibilities for an economy that produces two goods: Livestock Products and Aquaculture products Quantities that can be produced per month with the currently available resources Aquaculture products 6000 5900 5700 5400 5200 4100 Livestock products 0 100 200 300 350 500 Label point A B C D E F Required: (a) Explain the existence of opportunity costs in this situation. (b) Plot the PPF. Put Livestock goods on the vertical axis; Aquaculture on the horizontal axis. Label the points. Be sure each axis is to scale. Scales can differ between axes. (c) “Your PPF slopes down because of tradeoffs.” Explain that sentence in words that make sense to someone not taking economics.
- Below is a production possibilities table for consumer goods (automobiles) and capital goods (forklifts): a. Show these data graphically. Upon what specifific assumptions is this production possibilities curve based?b. If the economy is at point C, what is the cost of one more automobile? Of one more forklift? Explain how the production possibilities curve reflfl ects the law of increasing opportunity costs.c. If the economy characterized by this production possibilities table and curve were producing 3 automobiles and 20 fork lifts, what could you conclude about its use of its available resources?d. What would production at a point outside the production possibilities curve indicate? What must occur before the economy can attain such a level of production?Sketch a graph to illustarte your idea of each of the following relationships. Be sure to label both axes appropriatley. In each case explain uder what circumstances, if any, the curve should shift. 1. The amount of fertilizer added to an acre of land and the amount of corn grown on that land in one growing season 2. An automobile's horspower and it's gasoline mileage (in miles per gallon)The following is a production possibilities table for war goods and civilian goods: Production alternatives A B C D E Automobiles 0 2 4 6 8 (in millions) Guided missiles 30 27 21 12 0 (in thousands) •Show these production possibilities data graphically. •What does points on the curve indicate? •If the economy is currently at point C, what is the cost of 1 million more automobiles? Of more guided missiles? •Suppose improvement occurs in the technology of producing guided missiles but not in the production of automobiles. Draw the new production possibilities curve
- Table 1: Production Capacity of COVID-FREE LAND.Toilet Rolls Sanitizers30,000 028,000 1,00024,000 2,00018,000 3,00010,000 4,0000 5,000Use information in Table 1 above to answer the following questions: In your own words, while making use of the graph that you have created in part a, explain what the PPF is. Cleary state all assumptionsand properties of the PPF.4. a. Suppose that you are on a deserted island and can produce either 32 tons of coconuts OR 16 tons of pineapples. Draw the PPF representing this situation. Assume that coconuts are on the x-axis. Also assume that the PPF is linear. Clearly label your graph. b. For each of the following combinations say whether they are attainable (feasible) or unattainable (infeasible), based on the above information. If they are feasible, say whether they are efficient or inefficient. Also, label the three points on the graph above. (i) 8 tons of coconuts and 12 tons of pineapples: (ii) 16 tons of coconuts and 3 tons of pineapples:Problem 3Suppose the following data reflect the production possibilities for providing healthcare and education:Units per YearHealth Care 400 370 330 270 190 100 0Education 0 20 40 50 60 70 80(a) Graph the production possibilities curve.(b) If maximum health care is provided, how much education will be provided?(c) What is the opportunity cost of increasing health care from 270 to 330 units?