Choose the correct histogram below. The last digit of the heights of 42 statistics students were obtained as part of an experiment conducted for a class. Use the frequency distribution to the right to construct a histogram. Digit Frequency 5 A. 6- 5 0123456 7 8 9 3 4 4 O B. 6. 4 4 012345 6 7 8 9 8 3 OC. 12- 5 What can be concluded from the distribution of the digits? Specifically, do the heights appear to be reported or actually measured? 01234567 89 D. 12- 0- 01234567 89 Are the data reported or measured? O A. The data appears to be measured. The heights occur with roughly the same frequency. B. The data appears to be measured. Certain heights occur a disproportionate number of times. C. The data appears to be reported. Certain heights occur a disproportionate number of times.
Choose the correct histogram below. The last digit of the heights of 42 statistics students were obtained as part of an experiment conducted for a class. Use the frequency distribution to the right to construct a histogram. Digit Frequency 5 A. 6- 5 0123456 7 8 9 3 4 4 O B. 6. 4 4 012345 6 7 8 9 8 3 OC. 12- 5 What can be concluded from the distribution of the digits? Specifically, do the heights appear to be reported or actually measured? 01234567 89 D. 12- 0- 01234567 89 Are the data reported or measured? O A. The data appears to be measured. The heights occur with roughly the same frequency. B. The data appears to be measured. Certain heights occur a disproportionate number of times. C. The data appears to be reported. Certain heights occur a disproportionate number of times.

Glencoe Algebra 1, Student Edition, 9780079039897, 0079039898, 2018
18th Edition
ISBN:9780079039897
Author:Carter
Publisher:Carter
Chapter10: Statistics
Section10.4: Distributions Of Data
Problem 19PFA

Related questions
Question
Can you help me?
(This is not graded but, rather, an exercise to achieve acquisition. Overall, it is simply for learning; thus, it will not be calculated in my overall GPA).
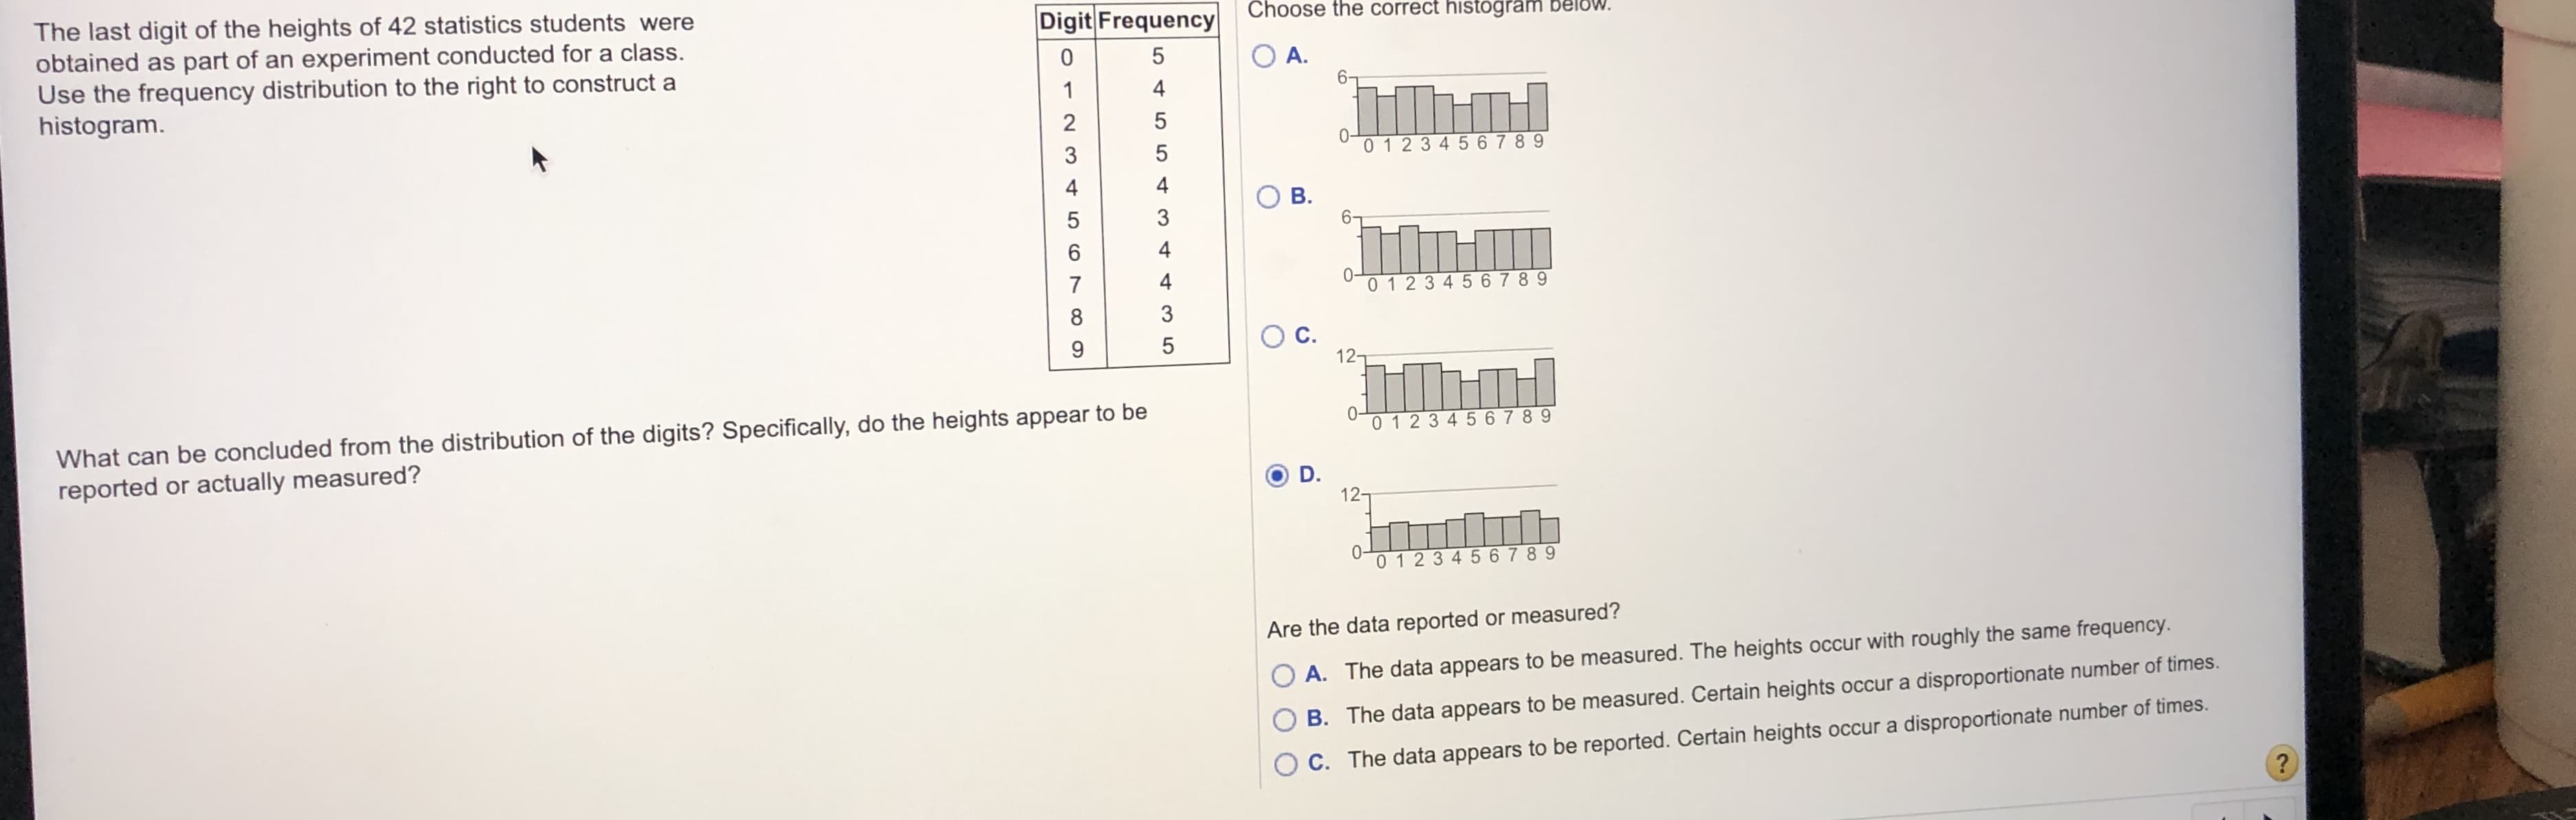
Transcribed Image Text:Choose the correct histogram below.
The last digit of the heights of 42 statistics students were
obtained as part of an experiment conducted for a class.
Use the frequency distribution to the right to construct a
histogram.
Digit Frequency
5
A.
6-
5
0123456 7 8 9
3
4
4
O B.
6.
4
4
012345 6 7 8 9
8
3
OC.
12-
5
What can be concluded from the distribution of the digits? Specifically, do the heights appear to be
reported or actually measured?
01234567 89
D.
12-
0-
01234567 89
Are the data reported or measured?
O A. The data appears to be measured. The heights occur with roughly the same frequency.
B. The data appears to be measured. Certain heights occur a disproportionate number of times.
C. The data appears to be reported. Certain heights occur a disproportionate number of times.
Expert Solution
This question has been solved!
Explore an expertly crafted, step-by-step solution for a thorough understanding of key concepts.

This is a popular solution!

Trending now
This is a popular solution!

Step by step
Solved in 2 steps with 1 images

Knowledge Booster


Learn more about
Need a deep-dive on the concept behind this application? Look no further. Learn more about this topic, statistics and related others by exploring similar questions and additional content below.Recommended textbooks for you
Glencoe Algebra 1, Student Edition, 9780079039897…
Algebra
ISBN:
9780079039897
Author:
Carter
Publisher:
McGraw Hill
Glencoe Algebra 1, Student Edition, 9780079039897…
Algebra
ISBN:
9780079039897
Author:
Carter
Publisher:
McGraw Hill