Complete parts (a) through (d) for the sampling distribution of the sample mean shown in the accompanying graph. Click the icon to view the graph. (a) What is the value of u? The value of u; is 700 (b) What is the value of o;? The value of o; is 20. (c) If the sample size is n= 9, what is likely true about the shape of the population? O A. The shape of the population is skewed right. B. The shape of the population is approximately normal. OC. The shape of the population is skewed left. O D. The shape of the population cannot be determined. (d) If the sample size is n= 9, what is the standard deviation of the population from which the sample was drawn? The standard deviation of the population from which the sample was drawn is 680 700 720 The distribution is normal. The locations of the peak and inflection points are shown.
Complete parts (a) through (d) for the sampling distribution of the sample mean shown in the accompanying graph. Click the icon to view the graph. (a) What is the value of u? The value of u; is 700 (b) What is the value of o;? The value of o; is 20. (c) If the sample size is n= 9, what is likely true about the shape of the population? O A. The shape of the population is skewed right. B. The shape of the population is approximately normal. OC. The shape of the population is skewed left. O D. The shape of the population cannot be determined. (d) If the sample size is n= 9, what is the standard deviation of the population from which the sample was drawn? The standard deviation of the population from which the sample was drawn is 680 700 720 The distribution is normal. The locations of the peak and inflection points are shown.

Glencoe Algebra 1, Student Edition, 9780079039897, 0079039898, 2018
18th Edition
ISBN:9780079039897
Author:Carter
Publisher:Carter
Chapter10: Statistics
Section10.1: Measures Of Center
Problem 22PFA

Related questions
Question
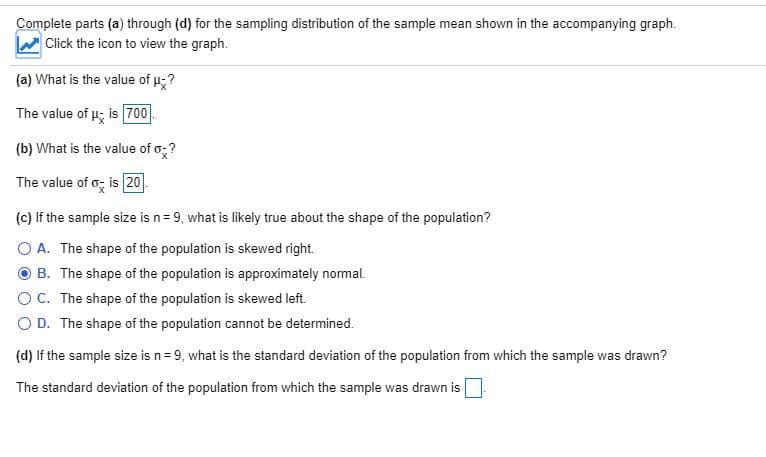
Transcribed Image Text:Complete parts (a) through (d) for the sampling distribution of the sample mean shown in the accompanying graph.
Click the icon to view the graph.
(a) What is the value of u?
The value of u; is 700
(b) What is the value of o;?
The value of o; is 20.
(c) If the sample size is n= 9, what is likely true about the shape of the population?
O A. The shape of the population is skewed right.
B. The shape of the population is approximately normal.
OC. The shape of the population is skewed left.
O D. The shape of the population cannot be determined.
(d) If the sample size is n= 9, what is the standard deviation of the population from which the sample was drawn?
The standard deviation of the population from which the sample was drawn is
Transcribed Image Text:680 700 720
The distribution is normal. The locations of the
peak and inflection points are shown.
Expert Solution
This question has been solved!
Explore an expertly crafted, step-by-step solution for a thorough understanding of key concepts.

This is a popular solution!

Trending now
This is a popular solution!

Step by step
Solved in 2 steps with 4 images

Recommended textbooks for you
Glencoe Algebra 1, Student Edition, 9780079039897…
Algebra
ISBN:
9780079039897
Author:
Carter
Publisher:
McGraw Hill

Holt Mcdougal Larson Pre-algebra: Student Edition…
Algebra
ISBN:
9780547587776
Author:
HOLT MCDOUGAL
Publisher:
HOLT MCDOUGAL

Glencoe Algebra 1, Student Edition, 9780079039897…
Algebra
ISBN:
9780079039897
Author:
Carter
Publisher:
McGraw Hill
Holt Mcdougal Larson Pre-algebra: Student Edition…
Algebra
ISBN:
9780547587776
Author:
HOLT MCDOUGAL
Publisher:
HOLT MCDOUGAL