Conduct the hypothesis test and provide the test statistic and the critical value, and state the conclusion. A person randomly selected 100 checks and recorded the cents portions of those checks. The table below lists those cents portions categorized according to the indicated values. Use a 0.10 significance level to test the claim that four categories are equally likely. The person expected that many checks for whole dollar amounts would result in a disproportionately high frequency for the first category, but do the results support that expectation? Cents portion of check Number 0-24 50 25-49 22 50-74 11 75-99 17 Click here to view the chi-square distribution table The test statistic isn. (Round to three decimal places as needed.) The critical value is (Round to three decimal places as needed.) State the conclusion. V Họ. There disproportionately high. V sufficient evidence to warrant rejection of the claim that the four categories are equally likely. The results to support the expectation that the frequency for the first category is
Conduct the hypothesis test and provide the test statistic and the critical value, and state the conclusion. A person randomly selected 100 checks and recorded the cents portions of those checks. The table below lists those cents portions categorized according to the indicated values. Use a 0.10 significance level to test the claim that four categories are equally likely. The person expected that many checks for whole dollar amounts would result in a disproportionately high frequency for the first category, but do the results support that expectation? Cents portion of check Number 0-24 50 25-49 22 50-74 11 75-99 17 Click here to view the chi-square distribution table The test statistic isn. (Round to three decimal places as needed.) The critical value is (Round to three decimal places as needed.) State the conclusion. V Họ. There disproportionately high. V sufficient evidence to warrant rejection of the claim that the four categories are equally likely. The results to support the expectation that the frequency for the first category is

College Algebra (MindTap Course List)
12th Edition
ISBN:9781305652231
Author:R. David Gustafson, Jeff Hughes
Publisher:R. David Gustafson, Jeff Hughes
Chapter8: Sequences, Series, And Probability
Section8.7: Probability
Problem 8E: List the sample space of each experiment. Picking a one-digit number

Related questions

Topic Video
Question
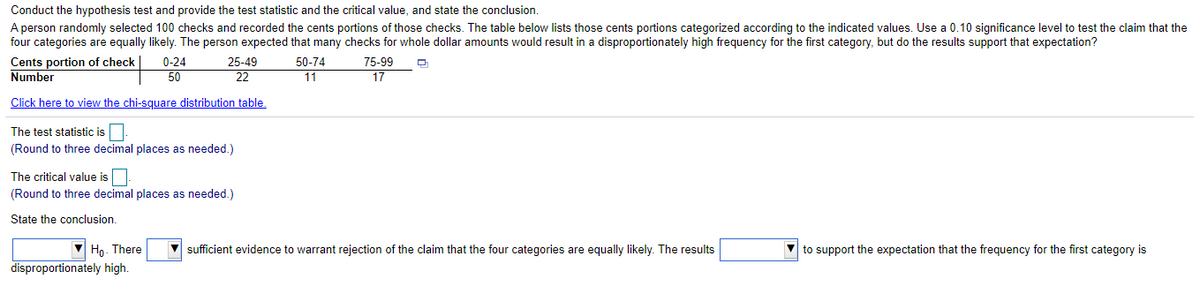
Transcribed Image Text:Conduct the hypothesis test and provide the test statistic and the critical value, and state the conclusion.
A person randomly selected 100 checks and recorded the cents portions of those checks. The table below lists those cents portions categorized according to the indicated values. Use a 0.10 significance level to test the claim that the
four categories are equally likely. The person expected that many checks for whole dollar amounts would result in a disproportionately high frequency for the first category, but do the results support that expectation?
Cents portion of check
Number
0-24
25-49
50-74
75-99
17
50
22
11
Click here to view the chi-square distribution table.
The test statistic is
(Round to three decimal places as needed.)
The critical value is.
(Round to three decimal places as needed.)
State the conclusion.
V Họ. There
disproportionately high.
sufficient evidence to warrant rejection of the claim that the four categories are equally likely. The results
to support the expectation that the frequency for the first category is
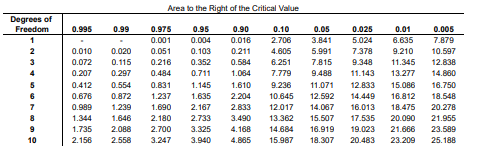
Transcribed Image Text:Area to the Right of the Critical Value
Degrees of
Freedom
0.995
0.99
0.975
0.95
0.90
0.10
0.05
0.025
0.01
0.005
0.001
0.004
0.016
2.706
3.841
5.024
6.635
7.879
2
0.010
0.020
0.051
0.103
0.211
4.605
5.991
7.378
9.210
10.597
3
0.072
0.115
0.216
0.352
0.584
6.251
7.815
9.348
11.345
12.838
0.207
0.297
0.484
0.711
1.064
7.779
9.488
11.143
13.277
14.860
0.412
0.554
0.831
1.145
1.610
9.236
11.071
12.833
15.086
16.750
6
0.676
0.872
1.237
1.635
2.204
10.645
12.592
14.449
16.812
18.548
0.989
1.239
1.690
2.167
2.833
12.017
14.067
16.013
18.475
20.278
1.344
1.646
2.180
2.733
3.490
13.362
15.507
17.535
20.090
21.955
1.735
2.088
2.700
3.325
4.168
14.684
16.919
19.023
21.666
23.589
10
2.156
2.558
3.247
3.940
4.865
15.987
18.307
20.483
23.209
25.188
Expert Solution
This question has been solved!
Explore an expertly crafted, step-by-step solution for a thorough understanding of key concepts.

This is a popular solution!

Trending now
This is a popular solution!

Step by step
Solved in 2 steps

Knowledge Booster


Learn more about
Need a deep-dive on the concept behind this application? Look no further. Learn more about this topic, probability and related others by exploring similar questions and additional content below.Recommended textbooks for you
College Algebra (MindTap Course List)
Algebra
ISBN:
9781305652231
Author:
R. David Gustafson, Jeff Hughes
Publisher:
Cengage Learning

Glencoe Algebra 1, Student Edition, 9780079039897…
Algebra
ISBN:
9780079039897
Author:
Carter
Publisher:
McGraw Hill

College Algebra (MindTap Course List)
Algebra
ISBN:
9781305652231
Author:
R. David Gustafson, Jeff Hughes
Publisher:
Cengage Learning
Glencoe Algebra 1, Student Edition, 9780079039897…
Algebra
ISBN:
9780079039897
Author:
Carter
Publisher:
McGraw Hill