Consider a hypothetical open economy. The following table presents data on the relationship between various real interest rates and national saving, domestic investment, and net capital outflow in this economy, where the currency is the U.S. dollar. Assume that the economy is currently experiencing a balanced government budget. Real Interest Rate National Saving Domestic Investment Net Capital Outflow (Percent) (Billions of dollars) (Billions of dollars) (Billions of dollars) 7 60 25 -10 6 55 30 -5 5 50 35 0 4 45 40 5 3 40 45 10 2 35 50 15 Given the information in the preceding table, use the blue points (circle symbol) to plot the demand for loanable funds. Next, use the orange points (square symbol) to plot the supply of loanable funds. Finally, use the black point (cross symbol) to indicate the equilibrium in this market. On the following graph, plot the relationship between the real interest rate and net capital outflow by using the green points (triangle symbol) to plot the points from the initial data table. Then use the black point (X symbol) to indicate the level of net capital outflow at the equilibrium real interest rate you derived in the previous graph


Consider a hypothetical open economy. The following table presents data on the relationship between various real interest rates and national saving, domestic investment, and net capital outflow in this economy, where the currency is the U.S. dollar. Assume that the economy is currently experiencing a balanced government budget.
|
Real Interest Rate |
National Saving |
Domestic Investment |
Net Capital Outflow |
|
(Percent) |
(Billions of dollars) |
(Billions of dollars) |
(Billions of dollars) |
|
7 |
60 |
25 |
-10 |
|
6 |
55 |
30 |
-5 |
|
5 |
50 |
35 |
0 |
|
4 |
45 |
40 |
5 |
|
3 |
40 |
45 |
10 |
|
2 |
35 |
50 |
15 |
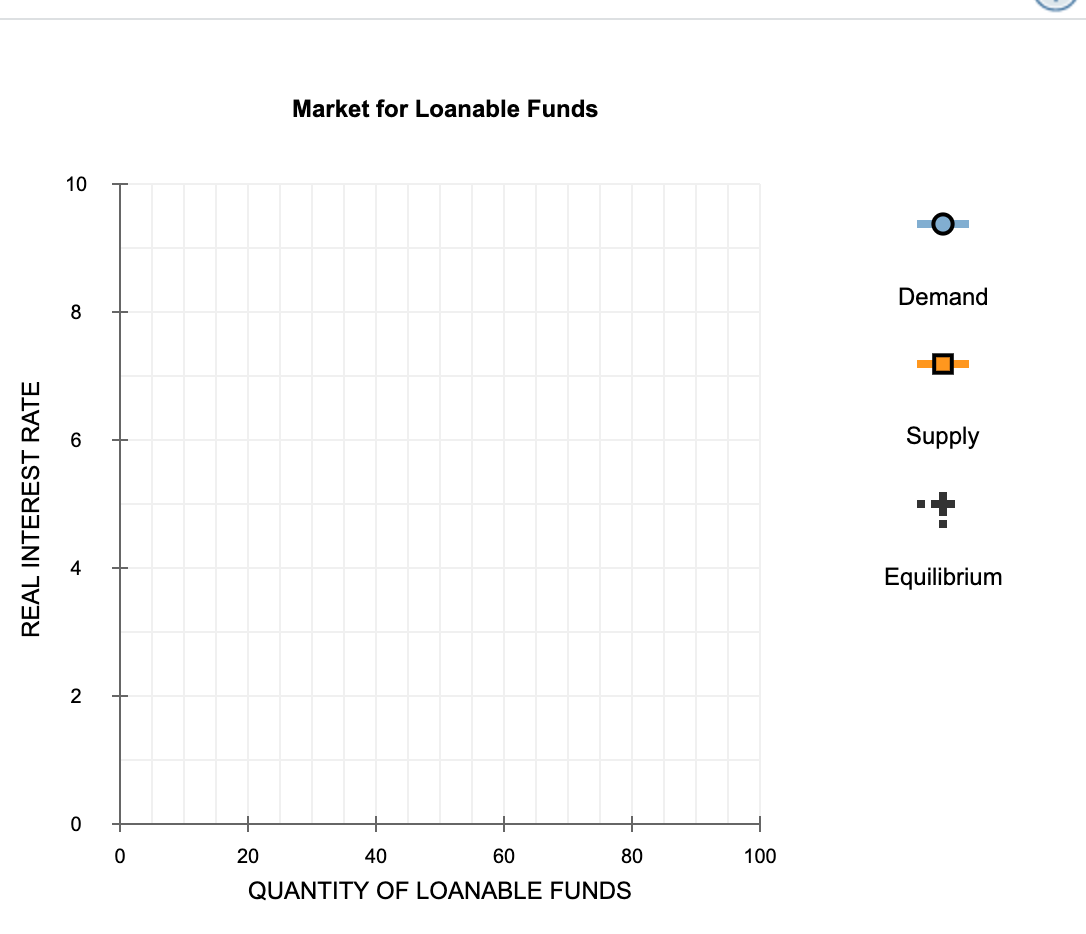
Given the information in the preceding table, use the blue points (circle symbol) to plot the demand for loanable funds. Next, use the orange points (square symbol) to plot the supply of loanable funds. Finally, use the black point (cross symbol) to indicate the equilibrium in this market.
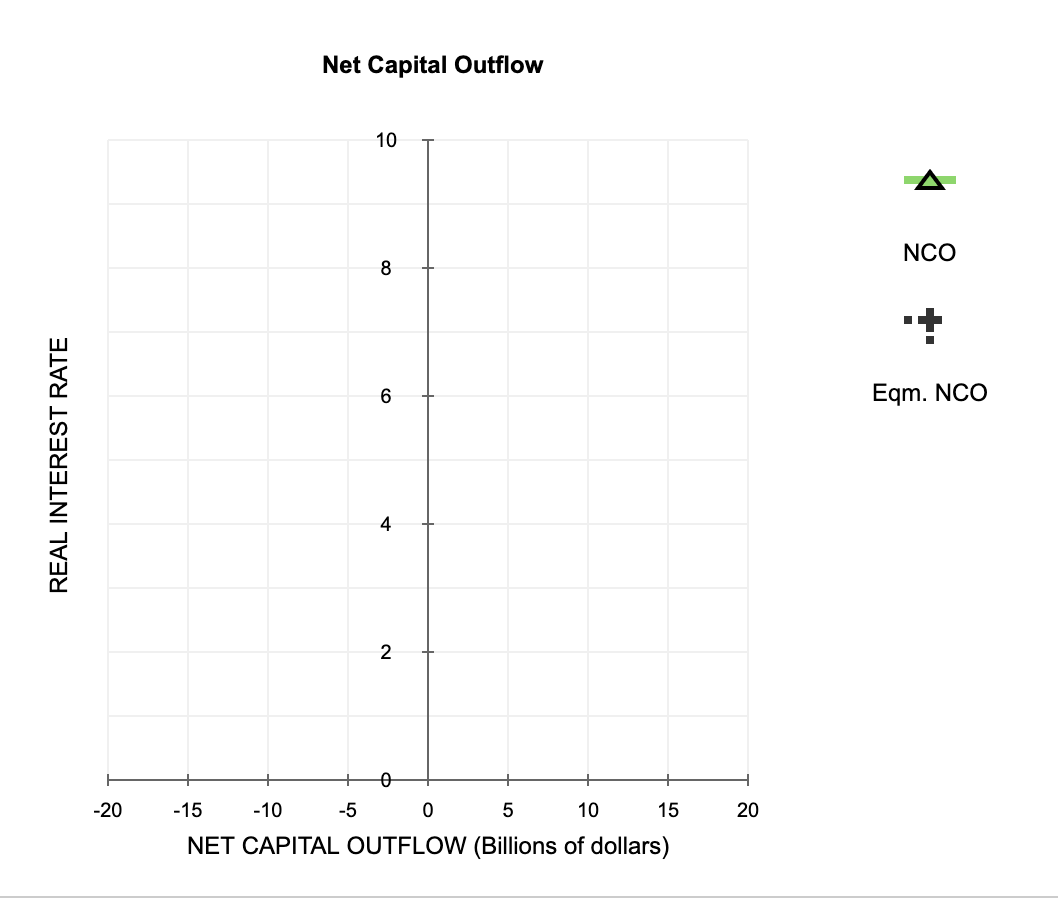
On the following graph, plot the relationship between the real interest rate and net capital outflow by using the green points (triangle symbol) to plot the points from the initial data table. Then use the black point (X symbol) to indicate the level of net capital outflow at the equilibrium real interest rate you derived in the previous graph.


Trending now
This is a popular solution!

Step by step
Solved in 4 steps with 2 images


