Consider a uniform density curve defined from x = 0 to x = 4. What percent of observations fall below 3? a) O 0.33 b) O0.25 c) O 0.87 d) O 0.30 e) O 0.75 f). O None of the above
Consider a uniform density curve defined from x = 0 to x = 4. What percent of observations fall below 3? a) O 0.33 b) O0.25 c) O 0.87 d) O 0.30 e) O 0.75 f). O None of the above

Mathematics For Machine Technology
8th Edition
ISBN:9781337798310
Author:Peterson, John.
Publisher:Peterson, John.
Chapter29: Tolerance, Clearance, And Interference
Section: Chapter Questions
Problem 16A: Spacers are manufactured to the mean dimension and tolerance shown in Figure 29-12. An inspector...

Related questions
Question
Transcribed Image Text:Quiz.áspx?id=2EACA88A-F95C-47B3-9315-8A57EFCC118E#q3
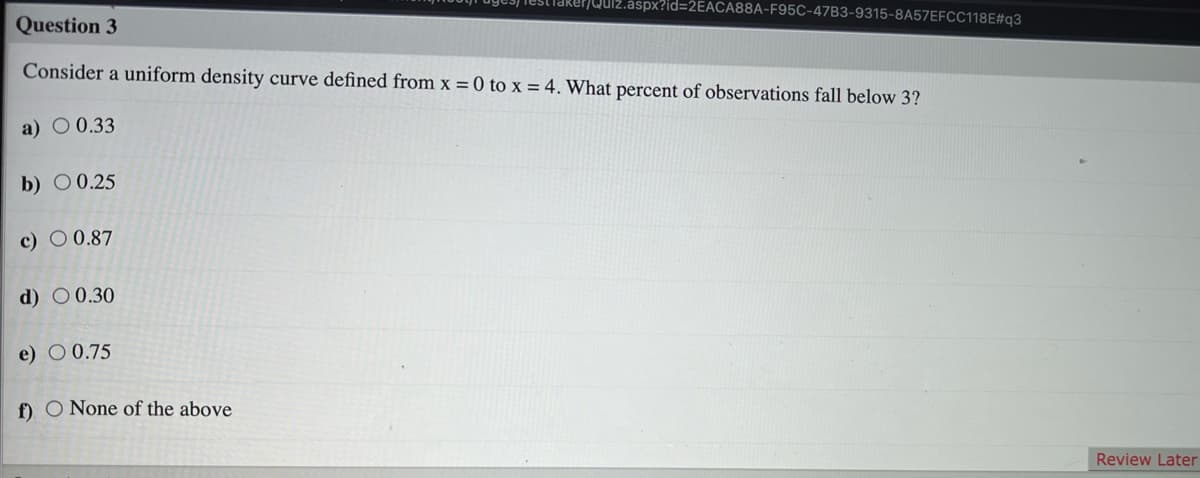
Question 3
Consider a uniform density curve defined from x = 0 to x = 4. What percent of observations fall below 3?
a) O 0.33
b) O 0.25
c) O 0.87
d) O0.30
e) O 0.75
f). O None of the above
Review Later
Expert Solution
This question has been solved!
Explore an expertly crafted, step-by-step solution for a thorough understanding of key concepts.

This is a popular solution!

Trending now
This is a popular solution!

Step by step
Solved in 2 steps with 2 images

Recommended textbooks for you
Mathematics For Machine Technology
Advanced Math
ISBN:
9781337798310
Author:
Peterson, John.
Publisher:
Cengage Learning,
Mathematics For Machine Technology
Advanced Math
ISBN:
9781337798310
Author:
Peterson, John.
Publisher:
Cengage Learning,