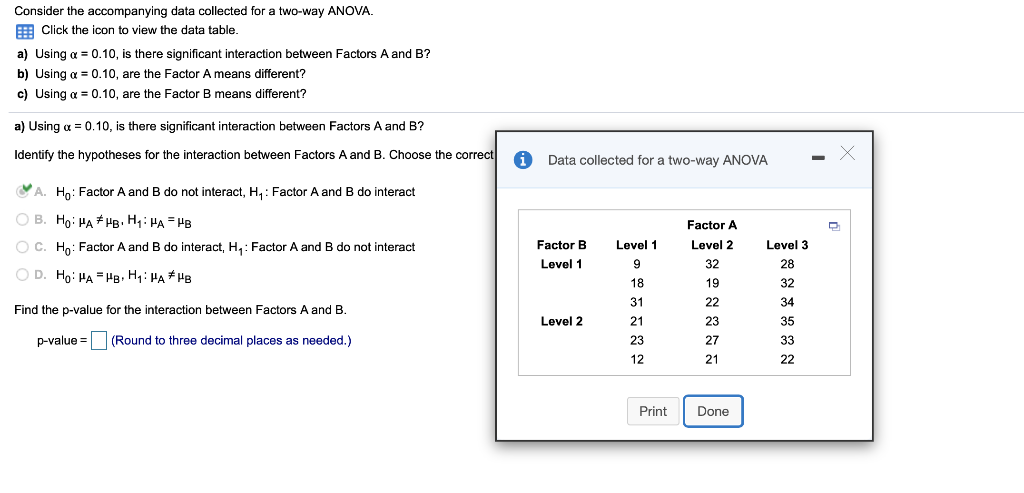
Consider the accompanying data collected for a two-way ANOVA. E Click the icon to view the data table. a) Using a = 0.10, is there significant interaction between Factors A and B? b) Using a = 0.10, are the Factor A means different? c) Using a = 0.10, are the Factor B means different? a) Using a = 0.10, is there significant interaction between Factors A and B? Identify the hypotheses for the interaction between Factors A and B. Choose the correct Data collected for a two-way ANOVA A. Ho: Factor A and B do not interact, H,: Factor A and B do interact O B. Ho: HA # PB. H: HA =Pe Factor A OC. Ho: Factor A and B do interact, H,: Factor A and B do not interact Factor B Level 1 Level 2 Level 3 Level 1 9 32 28 O D. Ho: HA =HR, H: PA #Pe 18 19 32 31 22 34 Find the p-value for the interaction between Factors A and B. Level 2 21 23 35 p-value = (Round to three decimal places as needed.) 23 27 33 12 21 22 Print Done


Inverse Normal Distribution
The method used for finding the corresponding z-critical value in a normal distribution using the known probability is said to be an inverse normal distribution. The inverse normal distribution is a continuous probability distribution with a family of two parameters.
Mean, Median, Mode
It is a descriptive summary of a data set. It can be defined by using some of the measures. The central tendencies do not provide information regarding individual data from the dataset. However, they give a summary of the data set. The central tendency or measure of central tendency is a central or typical value for a probability distribution.
Z-Scores
A z-score is a unit of measurement used in statistics to describe the position of a raw score in terms of its distance from the mean, measured with reference to standard deviation from the mean. Z-scores are useful in statistics because they allow comparison between two scores that belong to different normal distributions.


Trending now
This is a popular solution!

Step by step
Solved in 3 steps with 10 images


