Consider the following data on production volume (x) and total cost (y) for a manufacturing operation. Excel File: data14-29.xlsx Production Volume (units) Total Cost ($) 400 450 4000 5000 5400 550 600 5900 700 6400 750 7000 The estimated regression equation is ŷ = 1246.67 + 7.6x. Use a = 0.05 to test whether the production volume is significantly related to the total Complete the ANOVA table. Enter all values with nearest whole number, except the F test statistic (to 2 decimals) and the p-value (to 4 decimals). Use Table 1 of Appendix B. Source of Degrees of Sum Mean p-value Variation Freedom of Squares Square Regression 400 160000 4000 Error Total
Consider the following data on production volume (x) and total cost (y) for a manufacturing operation. Excel File: data14-29.xlsx Production Volume (units) Total Cost ($) 400 450 4000 5000 5400 550 600 5900 700 6400 750 7000 The estimated regression equation is ŷ = 1246.67 + 7.6x. Use a = 0.05 to test whether the production volume is significantly related to the total Complete the ANOVA table. Enter all values with nearest whole number, except the F test statistic (to 2 decimals) and the p-value (to 4 decimals). Use Table 1 of Appendix B. Source of Degrees of Sum Mean p-value Variation Freedom of Squares Square Regression 400 160000 4000 Error Total

Algebra & Trigonometry with Analytic Geometry
13th Edition
ISBN:9781133382119
Author:Swokowski
Publisher:Swokowski
Chapter7: Analytic Trigonometry
Section7.6: The Inverse Trigonometric Functions
Problem 91E

Related questions

Concept explainers
Contingency Table
A contingency table can be defined as the visual representation of the relationship between two or more categorical variables that can be evaluated and registered. It is a categorical version of the scatterplot, which is used to investigate the linear relationship between two variables. A contingency table is indeed a type of frequency distribution table that displays two variables at the same time.
Binomial Distribution
Binomial is an algebraic expression of the sum or the difference of two terms. Before knowing about binomial distribution, we must know about the binomial theorem.
Topic Video
Question
100%
chp 14 (8)
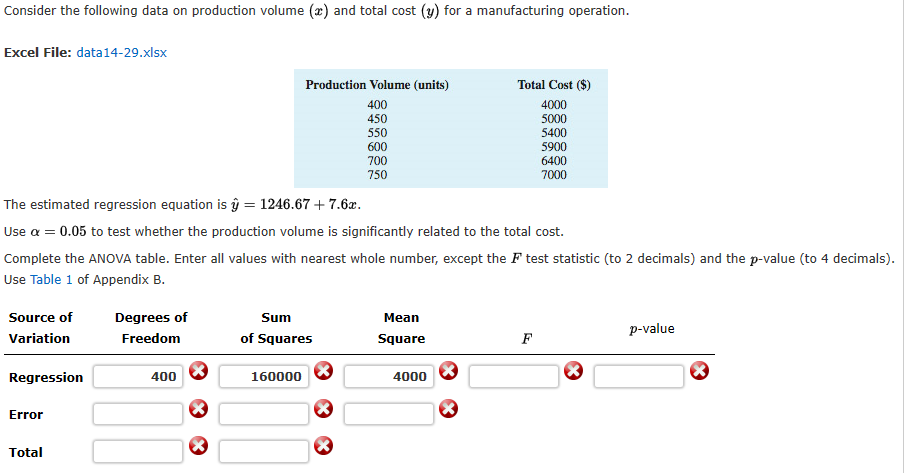
Transcribed Image Text:Consider the following data on production volume (x) and total cost (y) for a manufacturing operation.
Excel File: data14-29.xlsx
Production Volume (units)
Total Cost ($)
400
450
4000
5000
5400
550
600
5900
700
6400
750
7000
The estimated regression equation is ŷ = 1246.67 + 7.6x.
Use a = 0.05 to test whether the production volume is significantly related to the total
Complete the ANOVA table. Enter all values with nearest whole number, except the F test statistic (to 2 decimals) and the p-value (to 4 decimals).
Use Table 1 of Appendix B.
Source of
Degrees of
Sum
Mean
p-value
Variation
Freedom
of Squares
Square
Regression
400
160000
4000
Error
Total
Expert Solution
This question has been solved!
Explore an expertly crafted, step-by-step solution for a thorough understanding of key concepts.

This is a popular solution!

Trending now
This is a popular solution!

Step by step
Solved in 3 steps with 2 images

Knowledge Booster


Learn more about
Need a deep-dive on the concept behind this application? Look no further. Learn more about this topic, statistics and related others by exploring similar questions and additional content below.Recommended textbooks for you
Algebra & Trigonometry with Analytic Geometry
Algebra
ISBN:
9781133382119
Author:
Swokowski
Publisher:
Cengage

College Algebra
Algebra
ISBN:
9781305115545
Author:
James Stewart, Lothar Redlin, Saleem Watson
Publisher:
Cengage Learning

Functions and Change: A Modeling Approach to Coll…
Algebra
ISBN:
9781337111348
Author:
Bruce Crauder, Benny Evans, Alan Noell
Publisher:
Cengage Learning
Algebra & Trigonometry with Analytic Geometry
Algebra
ISBN:
9781133382119
Author:
Swokowski
Publisher:
Cengage
College Algebra
Algebra
ISBN:
9781305115545
Author:
James Stewart, Lothar Redlin, Saleem Watson
Publisher:
Cengage Learning
Functions and Change: A Modeling Approach to Coll…
Algebra
ISBN:
9781337111348
Author:
Bruce Crauder, Benny Evans, Alan Noell
Publisher:
Cengage Learning

Algebra and Trigonometry (MindTap Course List)
Algebra
ISBN:
9781305071742
Author:
James Stewart, Lothar Redlin, Saleem Watson
Publisher:
Cengage Learning
