Consider the following hypothesis from a sample of 13 observations that has the value t = 2.78: 3. Ho:u 40 Haiu40 What are the degrees of freedom for this statistic? a. Give the two critical values t* from t Distribution table that bracket t b. Between what two values does the P-value of the test fall? c. Is the value t 2.78 statistically significant at the 5% level? At the 1% level? d. Use Stata to find the exact P-value. What is the Stata command you used to find the exact P e. value?
Consider the following hypothesis from a sample of 13 observations that has the value t = 2.78: 3. Ho:u 40 Haiu40 What are the degrees of freedom for this statistic? a. Give the two critical values t* from t Distribution table that bracket t b. Between what two values does the P-value of the test fall? c. Is the value t 2.78 statistically significant at the 5% level? At the 1% level? d. Use Stata to find the exact P-value. What is the Stata command you used to find the exact P e. value?

Glencoe Algebra 1, Student Edition, 9780079039897, 0079039898, 2018
18th Edition
ISBN:9780079039897
Author:Carter
Publisher:Carter
Chapter10: Statistics
Section10.1: Measures Of Center
Problem 9PPS

Related questions
Question
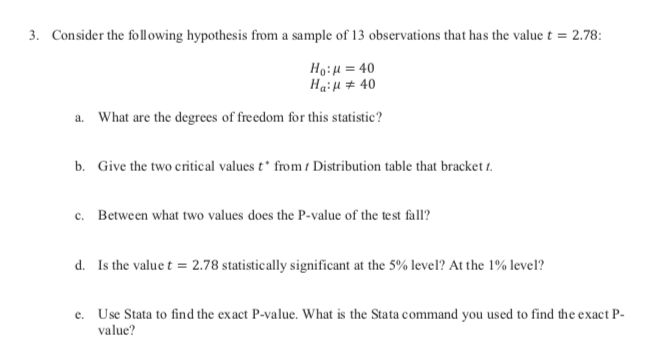
Transcribed Image Text:Consider the following hypothesis from a sample of 13 observations that has the value t = 2.78:
3.
Ho:u 40
Haiu40
What are the degrees of freedom for this statistic?
a.
Give the two critical values t* from t Distribution table that bracket t
b.
Between what two values does the P-value of the test fall?
c.
Is the value t 2.78 statistically significant at the 5% level? At the 1% level?
d.
Use Stata to find the exact P-value. What is the Stata command you used to find the exact P
e.
value?
Expert Solution
This question has been solved!
Explore an expertly crafted, step-by-step solution for a thorough understanding of key concepts.

This is a popular solution!

Trending now
This is a popular solution!

Step by step
Solved in 3 steps with 1 images

Recommended textbooks for you
Glencoe Algebra 1, Student Edition, 9780079039897…
Algebra
ISBN:
9780079039897
Author:
Carter
Publisher:
McGraw Hill
Glencoe Algebra 1, Student Edition, 9780079039897…
Algebra
ISBN:
9780079039897
Author:
Carter
Publisher:
McGraw Hill