Consider the hypothesis test below. The following results are for independent samples taken from the two populations. Use pooled estimator of p. a. What is the p-value (to 4 decimals)? Use Table 1 from Appendix B. b. With a = 0.05, what is your hypothesis testing conclusion? Conclude the difference between the proportions is greater than 0 V Ho: P1 - Pa ≤0 H.:P-P >0 Sample 1 721 = 100 P1 = 0.28 Sample 2 122= 300 P₂ = 0.18
Consider the hypothesis test below. The following results are for independent samples taken from the two populations. Use pooled estimator of p. a. What is the p-value (to 4 decimals)? Use Table 1 from Appendix B. b. With a = 0.05, what is your hypothesis testing conclusion? Conclude the difference between the proportions is greater than 0 V Ho: P1 - Pa ≤0 H.:P-P >0 Sample 1 721 = 100 P1 = 0.28 Sample 2 122= 300 P₂ = 0.18

MATLAB: An Introduction with Applications
6th Edition
ISBN:9781119256830
Author:Amos Gilat
Publisher:Amos Gilat
Chapter1: Starting With Matlab
Section: Chapter Questions
Problem 1P

Related questions
Question
I am at a loss. Each time I try to find the answers, I am told wrong. The text book is of no help with the formulas.
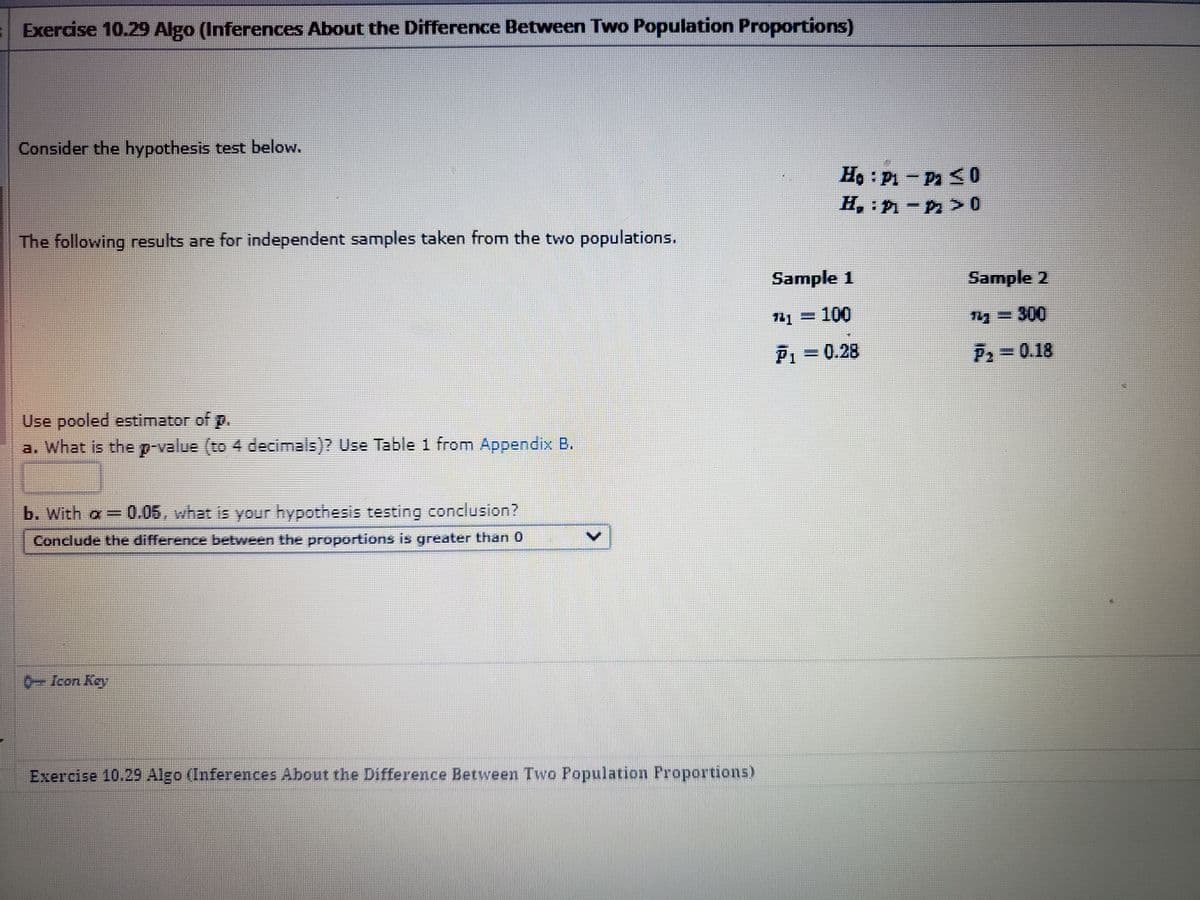
Transcribed Image Text:Exercise 10.29 Algo (Inferences About the Difference Between Two Population Proportions)
Consider the hypothesis test below.
The following results are for independent samples taken from the two populations.
Use pooled estimator of p.
a. What is the p-value (to 4 decimals)? Use Table 1 from Appendix B.
b. With a = 0.05, what is your hypothesis testing conclusion?
Conclude the difference between the proportions is greater than 0
6-Icon Key
Exercise 10.29 Algo (Inferences About the Difference Between Two Population Proportions)
Ho: Pi-Pa ≤0
H₂: P-P>0
Sample 1
¹4-100
P₁ = 0.28
Sample 2
143-300
F₂ = 0.18
Expert Solution
This question has been solved!
Explore an expertly crafted, step-by-step solution for a thorough understanding of key concepts.

This is a popular solution!

Trending now
This is a popular solution!

Step by step
Solved in 2 steps with 3 images

Recommended textbooks for you
MATLAB: An Introduction with Applications
Statistics
ISBN:
9781119256830
Author:
Amos Gilat
Publisher:
John Wiley & Sons Inc

Probability and Statistics for Engineering and th…
Statistics
ISBN:
9781305251809
Author:
Jay L. Devore
Publisher:
Cengage Learning

Statistics for The Behavioral Sciences (MindTap C…
Statistics
ISBN:
9781305504912
Author:
Frederick J Gravetter, Larry B. Wallnau
Publisher:
Cengage Learning
MATLAB: An Introduction with Applications
Statistics
ISBN:
9781119256830
Author:
Amos Gilat
Publisher:
John Wiley & Sons Inc
Probability and Statistics for Engineering and th…
Statistics
ISBN:
9781305251809
Author:
Jay L. Devore
Publisher:
Cengage Learning
Statistics for The Behavioral Sciences (MindTap C…
Statistics
ISBN:
9781305504912
Author:
Frederick J Gravetter, Larry B. Wallnau
Publisher:
Cengage Learning

Elementary Statistics: Picturing the World (7th E…
Statistics
ISBN:
9780134683416
Author:
Ron Larson, Betsy Farber
Publisher:
PEARSON

The Basic Practice of Statistics
Statistics
ISBN:
9781319042578
Author:
David S. Moore, William I. Notz, Michael A. Fligner
Publisher:
W. H. Freeman

Introduction to the Practice of Statistics
Statistics
ISBN:
9781319013387
Author:
David S. Moore, George P. McCabe, Bruce A. Craig
Publisher:
W. H. Freeman