Consider the market for paper. Suppose that a paper factory dumps toxic waste into a nearby river, creating a negative externality for those living downstream from the factory. Producing an additional ton of paper imposes a constant external cost of $105 per ton. The following graph shows the demand (private value) curve and the supply (private cost) curve for paper. Use the purple points (diamond symbol) to plot the social cost curve when the external cost is $105 per ton. The market equilibrium quantity is ___ tons of paper, but the socially optimal quantity of paper production is ___ tons. To create an incentive for the firm to produce the socially optimal quantity of paper, the government could impose a ___ of ___ per ton of paper.
Consider the market for paper. Suppose that a paper factory dumps toxic waste into a nearby river, creating a negative externality for those living downstream from the factory. Producing an additional ton of paper imposes a constant external cost of $105 per ton. The following graph shows the demand (private value) curve and the supply (private cost) curve for paper. Use the purple points (diamond symbol) to plot the social cost curve when the external cost is $105 per ton. The market equilibrium quantity is ___ tons of paper, but the socially optimal quantity of paper production is ___ tons. To create an incentive for the firm to produce the socially optimal quantity of paper, the government could impose a ___ of ___ per ton of paper.

Principles of Microeconomics
7th Edition
ISBN:9781305156050
Author:N. Gregory Mankiw
Publisher:N. Gregory Mankiw
Chapter10: Externalities
Section: Chapter Questions
Problem 3PA

Related questions
Question
Consider the market for paper. Suppose that a paper factory dumps toxic waste into a nearby river, creating a negative externality for those living downstream from the factory. Producing an additional ton of paper imposes a constant external cost of $105 per ton. The following graph shows the demand (private value) curve and the supply (private cost) curve for paper.
Use the purple points (diamond symbol) to plot the social cost curve when the external cost is $105 per ton.
The market equilibrium quantity is ___ tons of paper, but the socially optimal quantity of paper production is ___ tons.
To create an incentive for the firm to produce the socially optimal quantity of paper, the government could impose a ___ of ___ per ton of paper.
Transcribed Image Text:A ng.cengage.com
S Giants vs Cowboys Tickets, Dec 19 in East Rutherford | SeatGeek
b My Questions | bartleby
* Mind Tap - Cengage Learning
+
: Bridget v
* CENGAGE MINDTAP
Q Search this course
«
Homework (Ch 10)
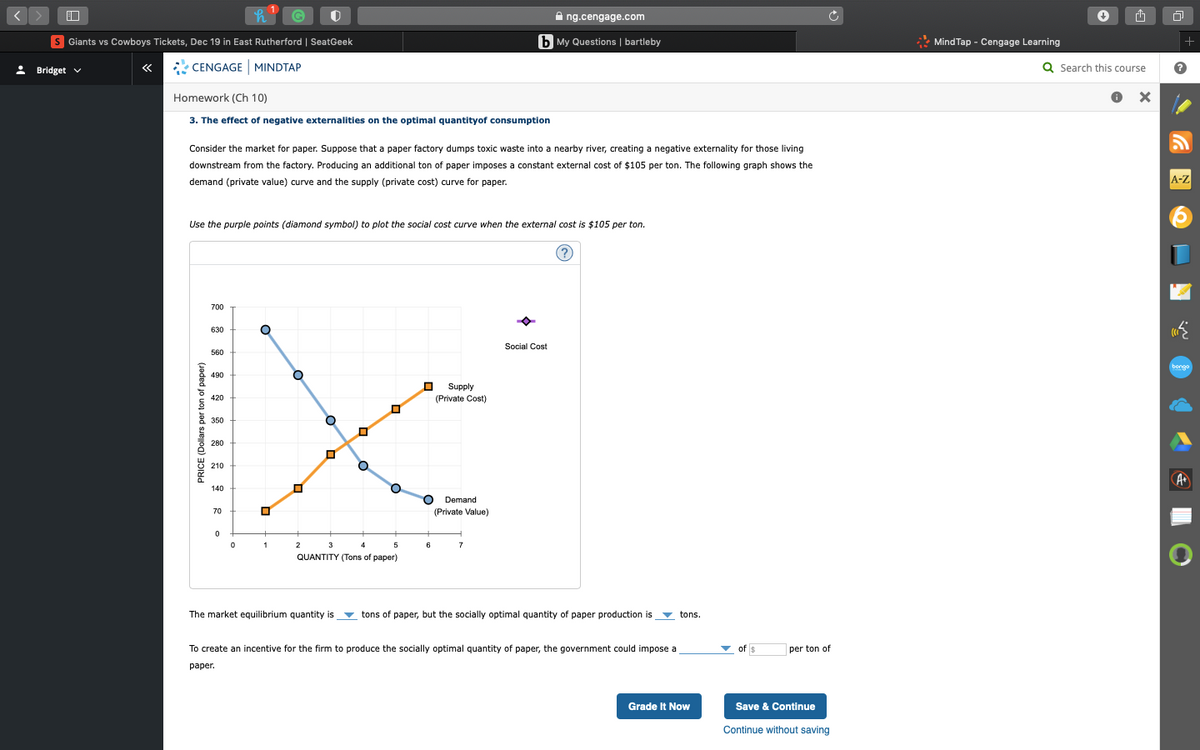
3. The effect of negative externalities on the optimal quantityof consumption
Consider the market for paper. Suppose that a paper factory dumps toxic waste into a nearby river, creating a negative externality for those living
downstream from the factory. Producing an additional ton of paper imposes a constant external cost of $105 per ton. The following graph shows the
demand (private value) curve and the supply (private cost) curve for paper.
A-Z
Use the purple points (diamond symbol) to plot the social cost curve when the external cost is $105 per ton.
(?
700
630
Social Cost
560
bongo
490
Supply
420
(Private Cost)
* 350
280
210
A
140
Demand
70
(Private Value)
1
2
3
4
6
7
QUANTITY (Tons of paper)
The market equilibrium quantity is
v tons of paper, but the socially optimal quantity of paper production is
v tons.
To create an incentive for the firm to produce the socially optimal quantity of paper, the government could impose a
- of $
per ton of
раper.
Grade It Now
Save & Continue
Continue without saving
PRICE (Dollars per ton of paper)
Expert Solution
This question has been solved!
Explore an expertly crafted, step-by-step solution for a thorough understanding of key concepts.

This is a popular solution!

Trending now
This is a popular solution!

Step by step
Solved in 2 steps with 1 images

Knowledge Booster


Learn more about
Need a deep-dive on the concept behind this application? Look no further. Learn more about this topic, economics and related others by exploring similar questions and additional content below.Recommended textbooks for you
Principles of Microeconomics
Economics
ISBN:
9781305156050
Author:
N. Gregory Mankiw
Publisher:
Cengage Learning

Principles of Economics 2e
Economics
ISBN:
9781947172364
Author:
Steven A. Greenlaw; David Shapiro
Publisher:
OpenStax

Essentials of Economics (MindTap Course List)
Economics
ISBN:
9781337091992
Author:
N. Gregory Mankiw
Publisher:
Cengage Learning
Principles of Microeconomics
Economics
ISBN:
9781305156050
Author:
N. Gregory Mankiw
Publisher:
Cengage Learning
Principles of Economics 2e
Economics
ISBN:
9781947172364
Author:
Steven A. Greenlaw; David Shapiro
Publisher:
OpenStax
Essentials of Economics (MindTap Course List)
Economics
ISBN:
9781337091992
Author:
N. Gregory Mankiw
Publisher:
Cengage Learning

Exploring Economics
Economics
ISBN:
9781544336329
Author:
Robert L. Sexton
Publisher:
SAGE Publications, Inc

Principles of Microeconomics (MindTap Course List)
Economics
ISBN:
9781305971493
Author:
N. Gregory Mankiw
Publisher:
Cengage Learning

Principles of Economics (MindTap Course List)
Economics
ISBN:
9781305585126
Author:
N. Gregory Mankiw
Publisher:
Cengage Learning