Consider the market for pens. Suppose that a new educational study has proven that the practice of writing, erasing, and rewriting improves students' ability to process information, leading parents to steer away from pen use in favor of pencils. Moreover, the price of ink, an important input in pen production, has increased considerably. On the following graph, labeled Scenario 1, indicate the effect these two events have on the demand for and supply of pens. Note: Select and drag one or both of the curves to the desired position. Curves will snap into position, so if you try to move a curve and it snaps back to its original position, just drag it a little farther. Scenario 1 10 Supply Demand 7 Supply Demand 1 3 10 QUANTITY (Millions of pens) Next, complete the following graph, labeled Scenario 2, by shifting the supply and demand curves in the same way that you did on the Scenario 1 graph. PRICE (Dollars per pen) 10 Supply Demand Supply 3 Demand 1 3 4 10 QUANTITY (Millions of pens) Compare both the Scenario 1 and Scenario 2 graphs. Notice that after completing both graphs, you can now see a difference between them that wasn't apparent before the shifts because each graph indicates different magnitudes for the supply and demand shifts in the market for pens. Use the results of your answers on both the Scenario 1 and Scenario 2 graphs to complete the following table. Begin by indicating the overall change in the equilibrium price and quantity after the shift in demand or supply for each shift-magnitude scenario. Then, in the final column, indicate the resulting change in the equilibrium price and quantity when supply and demand shift in the direction you previously indicated on both graphs. If you cannot determine the answer without knowing the magnitude of the shifts, choose Cannot determine. Change in Equilibrium Objects Scenario 2 Equilibrium Object Scenario 1 When Shift Magnitudes Are Unknown Price Quantity True or False: When both the demand and supply curves shift, you can always determine the effect on price and quantity without knowing the magnitude of the shifts. PRICE (Dollars per pen)
Consider the market for pens. Suppose that a new educational study has proven that the practice of writing, erasing, and rewriting improves students' ability to process information, leading parents to steer away from pen use in favor of pencils. Moreover, the price of ink, an important input in pen production, has increased considerably. On the following graph, labeled Scenario 1, indicate the effect these two events have on the demand for and supply of pens. Note: Select and drag one or both of the curves to the desired position. Curves will snap into position, so if you try to move a curve and it snaps back to its original position, just drag it a little farther. Scenario 1 10 Supply Demand 7 Supply Demand 1 3 10 QUANTITY (Millions of pens) Next, complete the following graph, labeled Scenario 2, by shifting the supply and demand curves in the same way that you did on the Scenario 1 graph. PRICE (Dollars per pen) 10 Supply Demand Supply 3 Demand 1 3 4 10 QUANTITY (Millions of pens) Compare both the Scenario 1 and Scenario 2 graphs. Notice that after completing both graphs, you can now see a difference between them that wasn't apparent before the shifts because each graph indicates different magnitudes for the supply and demand shifts in the market for pens. Use the results of your answers on both the Scenario 1 and Scenario 2 graphs to complete the following table. Begin by indicating the overall change in the equilibrium price and quantity after the shift in demand or supply for each shift-magnitude scenario. Then, in the final column, indicate the resulting change in the equilibrium price and quantity when supply and demand shift in the direction you previously indicated on both graphs. If you cannot determine the answer without knowing the magnitude of the shifts, choose Cannot determine. Change in Equilibrium Objects Scenario 2 Equilibrium Object Scenario 1 When Shift Magnitudes Are Unknown Price Quantity True or False: When both the demand and supply curves shift, you can always determine the effect on price and quantity without knowing the magnitude of the shifts. PRICE (Dollars per pen)

Chapter4: Supply And Demand: An Initial Look
Section: Chapter Questions
Problem 2TY

Related questions
Question
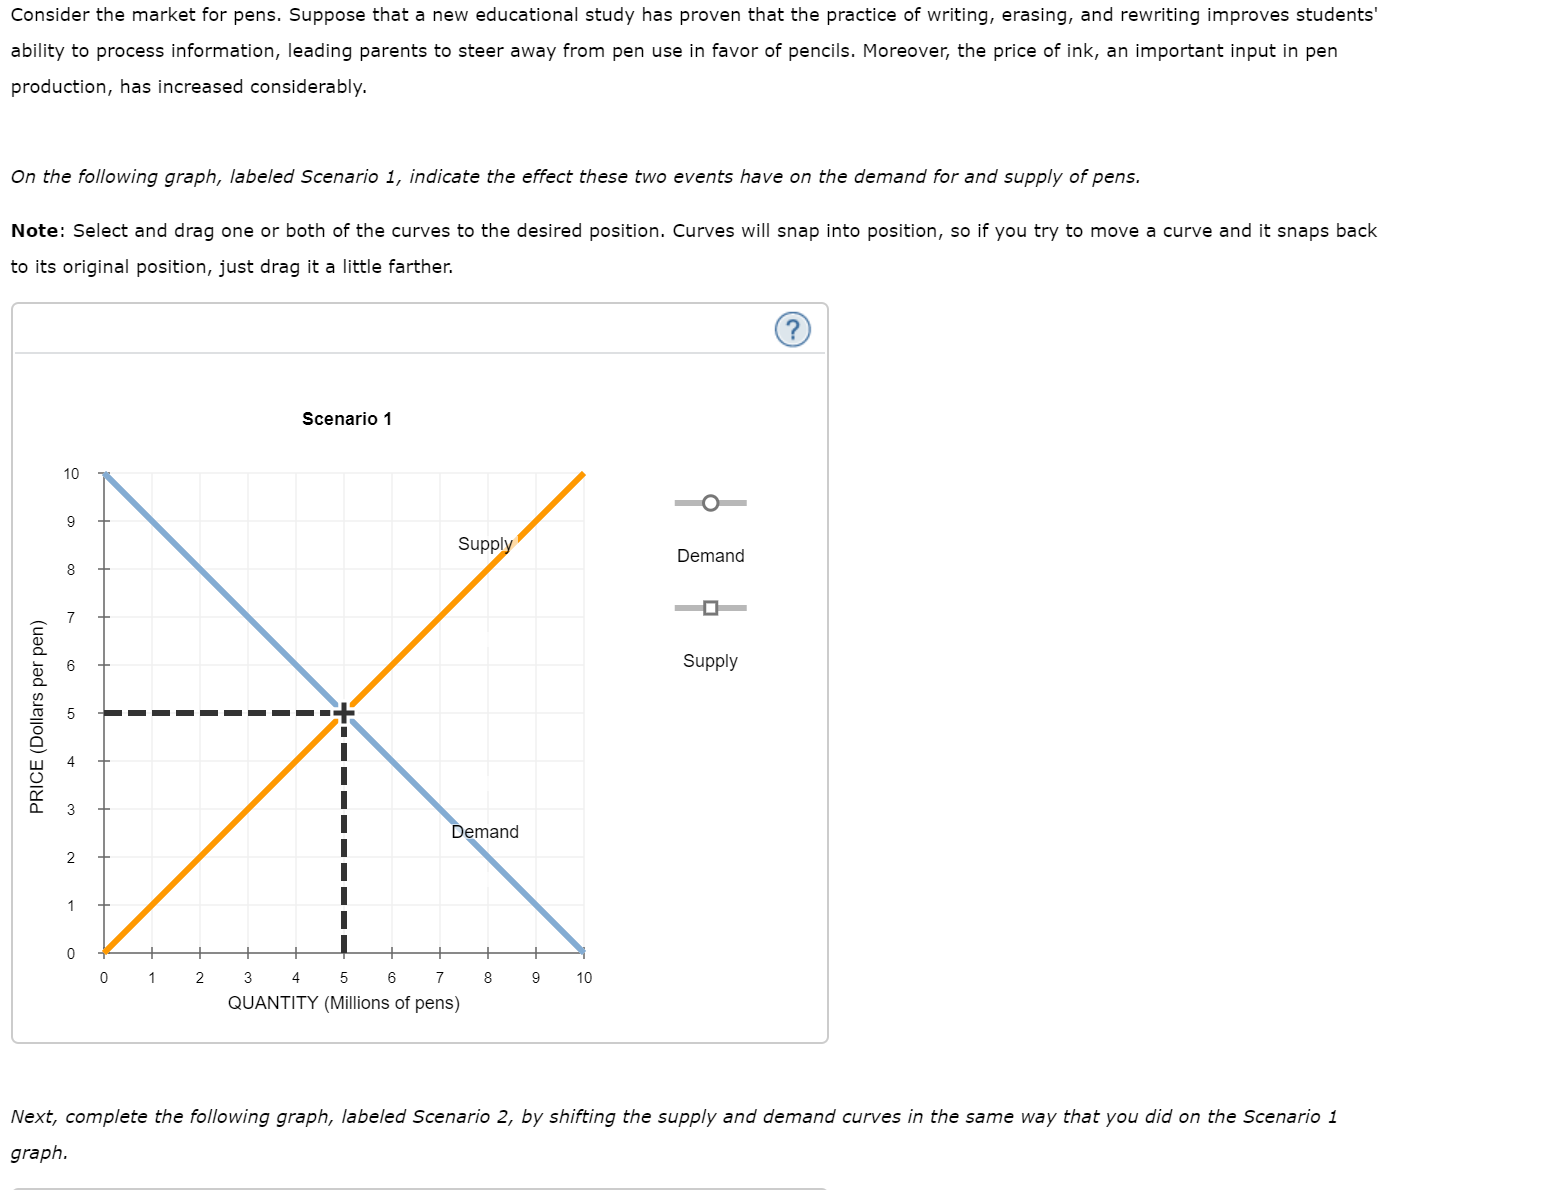
Transcribed Image Text:Consider the market for pens. Suppose that a new educational study has proven that the practice of writing, erasing, and rewriting improves students'
ability to process information, leading parents to steer away from pen use in favor of pencils. Moreover, the price of ink, an important input in pen
production, has increased considerably.
On the following graph, labeled Scenario 1, indicate the effect these two events have on the demand for and supply of pens.
Note: Select and drag one or both of the curves to the desired position. Curves will snap into position, so if you try to move a curve and it snaps back
to its original position, just drag it a little farther.
Scenario 1
10
Supply
Demand
7
Supply
Demand
1
3
10
QUANTITY (Millions of pens)
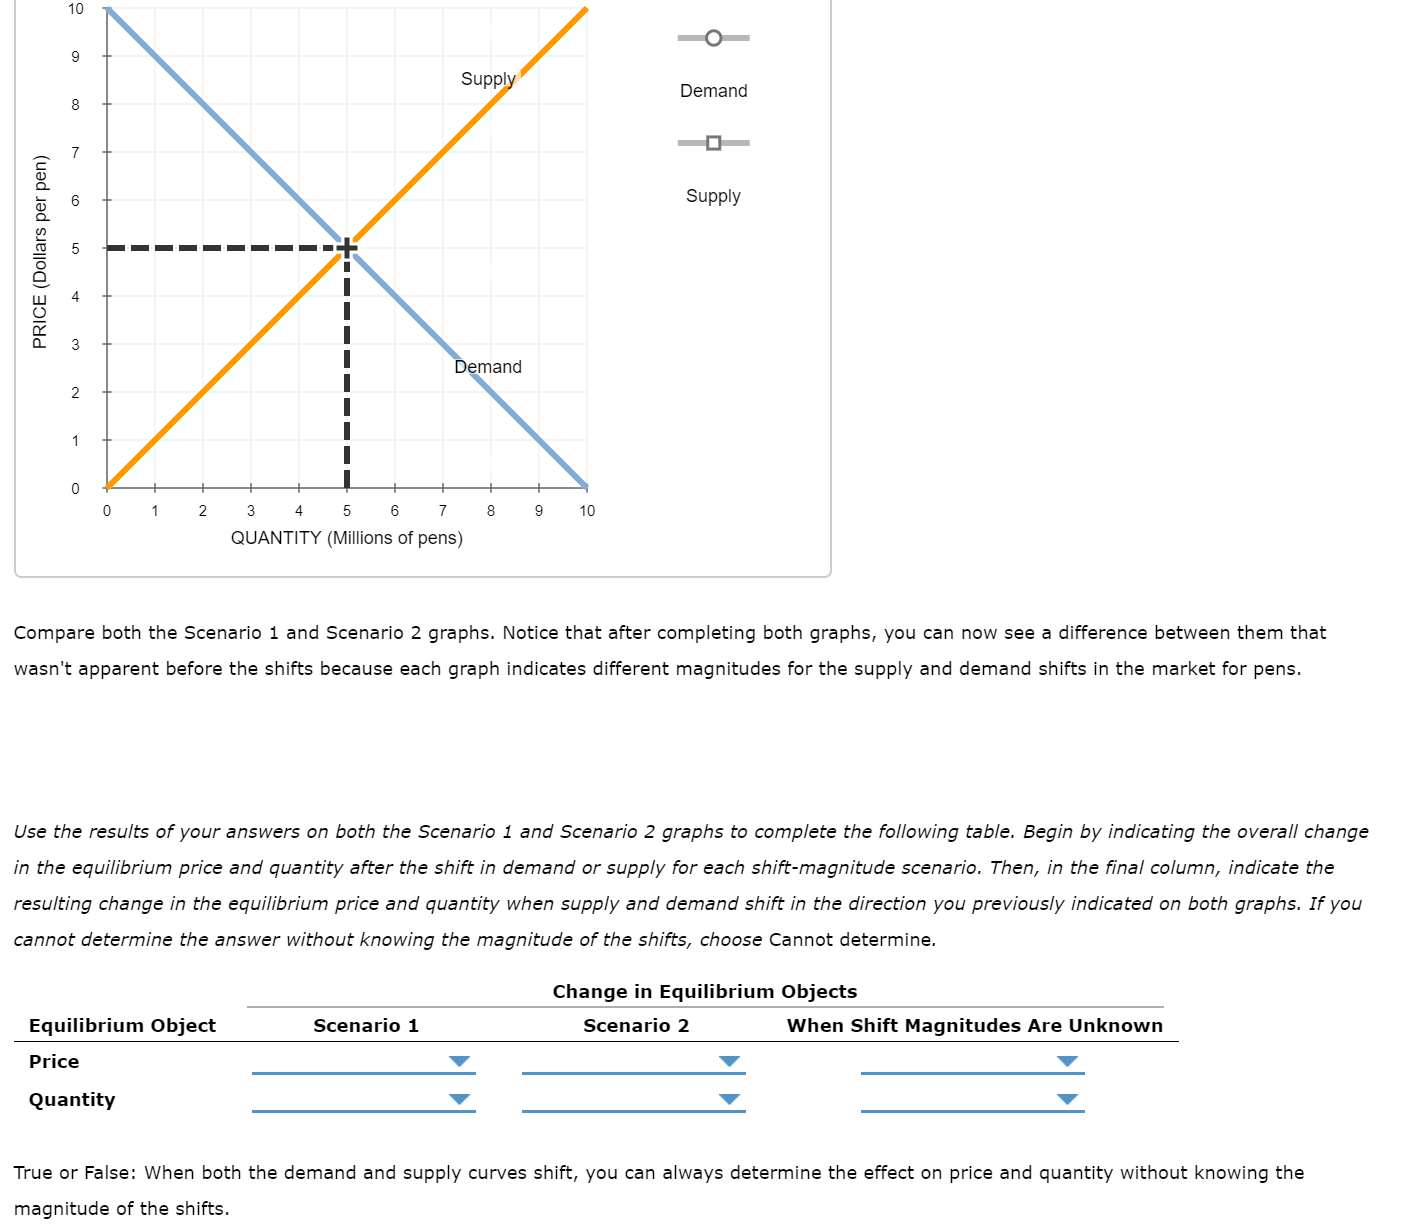
Next, complete the following graph, labeled Scenario 2, by shifting the supply and demand curves in the same way that you did on the Scenario 1
graph.
PRICE (Dollars per pen)
Transcribed Image Text:10
Supply
Demand
Supply
3
Demand
1
3
4
10
QUANTITY (Millions of pens)
Compare both the Scenario 1 and Scenario 2 graphs. Notice that after completing both graphs, you can now see a difference between them that
wasn't apparent before the shifts because each graph indicates different magnitudes for the supply and demand shifts in the market for pens.
Use the results of your answers on both the Scenario 1 and Scenario 2 graphs to complete the following table. Begin by indicating the overall change
in the equilibrium price and quantity after the shift in demand or supply for each shift-magnitude scenario. Then, in the final column, indicate the
resulting change in the equilibrium price and quantity when supply and demand shift in the direction you previously indicated on both graphs. If you
cannot determine the answer without knowing the magnitude of the shifts, choose Cannot determine.
Change in Equilibrium Objects
Scenario 2
Equilibrium Object
Scenario 1
When Shift Magnitudes Are Unknown
Price
Quantity
True or False: When both the demand and supply curves shift, you can always determine the effect on price and quantity without knowing the
magnitude of the shifts.
PRICE (Dollars per pen)
Expert Solution
This question has been solved!
Explore an expertly crafted, step-by-step solution for a thorough understanding of key concepts.

This is a popular solution!

Trending now
This is a popular solution!

Step by step
Solved in 5 steps with 3 images

Recommended textbooks for you

Exploring Economics
Economics
ISBN:
9781544336329
Author:
Robert L. Sexton
Publisher:
SAGE Publications, Inc

Exploring Economics
Economics
ISBN:
9781544336329
Author:
Robert L. Sexton
Publisher:
SAGE Publications, Inc


