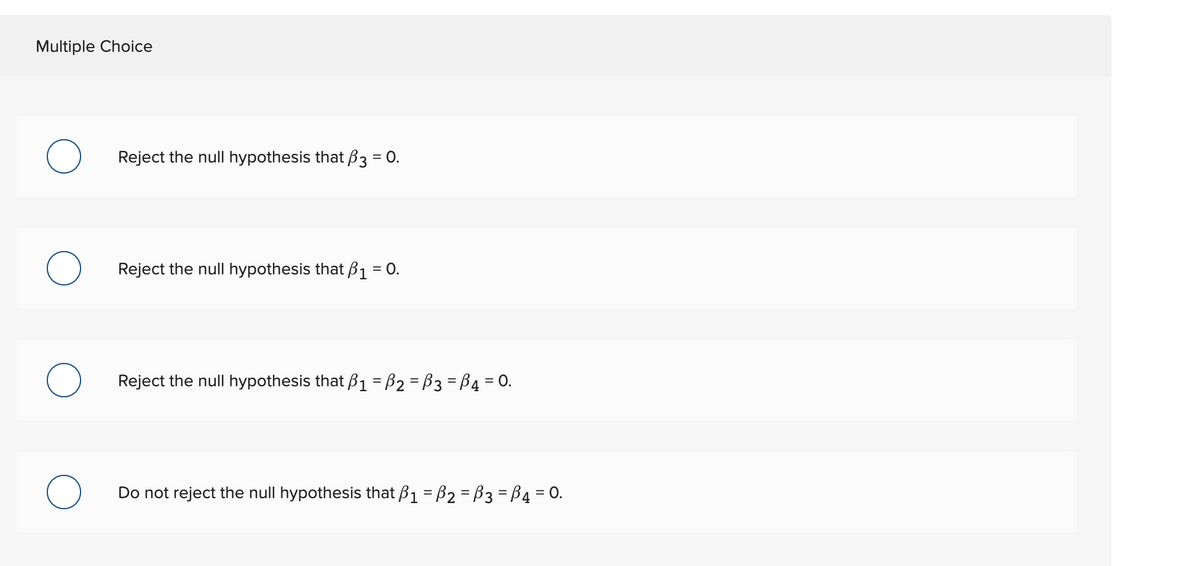
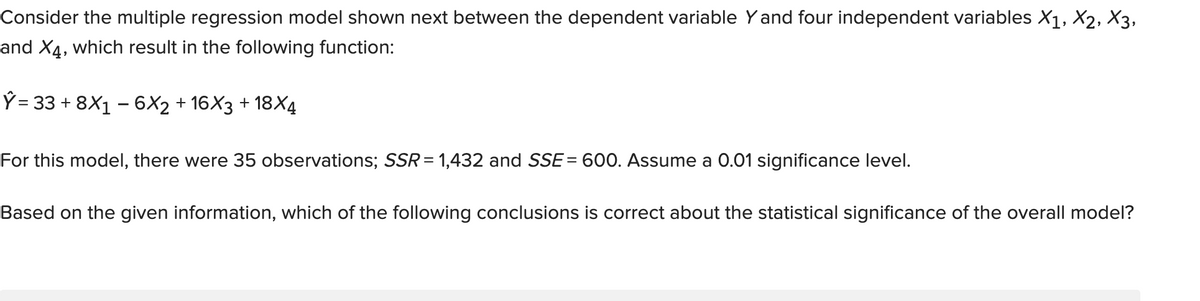
Consider the multiple regression model shown next between the dependent variable Y and four independent variables X1, X2, X3, and X4, which result in the following function: Ý= 33 + 8X1 – 6X2 + 16X3 + 18X4 For this model, there were 35 observations; SSR= 1,432 and SSE= 600. Assume a 0.01 significance level. Based on the given information, which of the following conclusions is correct about the statistical significance of the overall model?


Q: Determine the equation of the regression line for the following data, and compute the residuals.…
A: Computation: From the table, the summary of quantities are,
Q: 10) The following computer printout is for the following multiple linear regression model, G= Bo +…
A: We have given a result of regression equation and based on that we have to answer questions.
Q: Use the following set of points to test the null hypothesis H0:β1=0 versus H1:β1≠0. Use the P-value…
A:
Q: model involving 30 observations, the following estimated regression equation was obtained. ŷ = 170…
A: We know that the regression model is y^=β0+β1x+β2x2 where β0 is constant β1 is the coefficient on…
Q: Consider the following data generating process, Yt = Bo + B1*t + Et, where y and x are variables and…
A:
Q: Years of Work Experience and number of Job Offers of 10 job-seekers were as follows: Work Exp.…
A: from regression y = a + bx y is dependent variable = no of offers a intercept b is slope x…
Q: Consider the following simple regression model y = B0 + B1x1 + u and z is an instrument for x.…
A: Given Information: Consider the simple regression model: y=β0+β1x1+u (z is an instrument…
Q: Consider the following regression equation: Y,= Po+PX;+Hi where X, Y. Bo. B1, and , denote the…
A: Finding the heteroskedastic-robust estimator of the variance β^1
Q: In a typical multiple linear regression model where x1 and x2 are non-random regressors, the…
A: Given that, multiple linear regression model where x1 and x2, the expected value of the response…
Q: 4.For a sample of 12 observations, a businessman wants to regress the price (in dollar) of the…
A:
Q: Consider the following population regression model: Yi = Bo + B1D1i + B2Dzi + B3(D1¡D21) + uj,…
A: Given: the following population regression model: Y;= Bo + B1D1i +B2D2i+ B3(D1iP2i) + uj,, i = 1,…
Q: Consider the following data for a dependent variable y and two independent variables, x1 and x2; for…
A:
Q: For variables x1, x2, x3, and y satisfying the assumptions for multiple linear regression…
A: Distribution of regression parameters:
Q: Use the Durbin-Watson test to test, at 5% level of significance, for the presence of significant…
A: Null Hypothesis: H0: There is no significant linear correlation among the error terms. Alternative…
Q: Given the following Anova output of a regression output from MS Excel Source DF SS MS F…
A: Solution: k=4 independent variables n= 25 observation The ANOVA table is Source DF SS MS F…
Q: For variables x1, x2, x3, and y satisfying the assumptions for multiple linear regression…
A:
Q: Which regressors are meaningful at the 5% significance level according to the Minitab output given…
A: The output of the regression is given where the coefficient values and standard error of the…
Q: Consider the multiple regression model shown next between the dependent variable Y and four…
A:
Q: Use the following linear regression equation to answer the questions. x1 = 1.7 + 3.9x2 – 8.5x3 +…
A: Given linear equation, x1 = 1.7 + 3.9x2 – 8.5x3 + 2.2x4 Suppose x3 and x4 were held at fixed but…
Q: 10) The following computer printout is for the following multiple linear regression model, G= Bo +…
A: Introduction: The coefficient of determination or R2 value can be interpreted as the proportion or…
Q: Consider a simple linear regression model Y; = Bx; + €i, where e; are independently and identically…
A: Step 1: Consider the simple linear modelYi=β xi+εi where εi are iid with mean 0 and variance σ2. We…
Q: Suppose that a multiple linear regression model was fit to data and that the following output…
A: The regression is a method of machine learning under subgroup Supervised Learning. The regression…
Q: Consider the following Stata regression estimates (IDFB2) Source SS df MS Number of obs 935 F(3,…
A: There are 3 independent variables which are age, urban, IQ. The dependent variable is y. We have to…
Q: Ten observations were provided for a dependent variable y and two independent variables x1 and x2;…
A: From the given information, the value of SST is 15189.8 and the value of SSR is 14056.9.
Q: Consider the following data for a dependent variable y and two independent variables, and a; for…
A: The question is about multiple regression Given : SST = 15182.9 SSR = 14052.2
Q: To test for the significance of a regression model involving 4 independent variables and 36…
A: It is given that the number of observations are 36. Here, the number of independent variables, p is…
Q: A researcher would like to predict the dependent variable YY from the two independent variables X1X1…
A: Regression: The regression analysis is conducted here by using EXCEL. The software procedure is…
Q: Consider the following sample regressions for the linear and quadratic models along with their…
A: Since the R2 value for quadratic model (0.5844) is higher than Linear model (0.1317) And also…
Q: The following table gives the marks obtained by 10 students in POLI 344 (X) together with the marks…
A: Given: n = 11 Formula Used: Regression equation of Y on X: Y = a + bX Slope b = n∑XY-∑X∑Yn∑X2-∑X2…
Q: A researcher would like to predict the dependent variable Y from the two independent variables X1…
A: Null Hypothesis H0 : β1=β2=0 (i.e.,) All of the regression coefficients are zero Alternative…
Q: Consider the following multiple regression model. What are the correct null and alternative…
A: Null and alternative hypotheses: Null hypothesis: Null hypothesis is a statement which is tested for…
Q: In which of the following cases is an instrumental variable not used to obtain a consistent…
A: 1. It is not used when there is correlation between regressors.(B) Instrumental variable methods…
Q: SSreg=SSreg= SSres=SSres= R2=R2= F=F= P-value = What is your decision for the hypothesis test?…
A: We have used the excel data analysis tool to run the regression analysis.
Q: The following data represent a set of 10 experimental runs in which two independent variables X1 and…
A: The provided information is Y X1 X2 61.5 2400 54.5 61.2 2450 56.4 32 2500 43.2 52.5 2700…
Q: for a sample of N= 19 subjects. Use multiple linear regression to calculate the coefficient of…
A: Solution. We will solve this question by using Excel ,run the regression analysis in the data…
Q: Consider the following diagnostics table from a multiple linear regression with 2 covariates: ID…
A: "Since you have posted a question with multiple sub-parts, we will solve the first three sub-parts…
Q: Consider the following data for a dependent variable y and two independent variables, x, and x,. X1…
A: Since you have posted a question with multiple sub-parts, we will solve first three subparts for…
Q: A researcher would like to predict the dependent variable Y from the two independent variables X1…
A: Given: X1 X2 Y 38.4 58.8 48.2 63.4 47.9 55.6 48.4 54.6 33.1 54.9 48.7 47.4 54.8 54.2…
Q: Consider the following data for a dependent variable y and two independent variables, x1 and x2. X1…
A: The hypothesis testing for significant relationship is done using the F-test. The F-test statistic…
Q: The following is a partial computer output of a multiple regression analysis of a data set…
A: The provided information is: The regression equation is,SALEPRIC = 1470 + 0.814 LANDVAL + 0.820…
Q: en observations were provided for a dependent variable y and two independent variables x1 and x2;…
A:
Q: A researcher would like to predict the dependent variable YY from the two independent variables X1X1…
A: Hello! As you have posted more than 3 sub parts, we are answering the first 3 sub-parts. In case…
Q: Use the following set of points to test the null hypothesis Ho: P₁0 versus H₁: B₁ #0. Use the…
A: Given: H0:β1=0 H1:β1≠0 Level of significance α=0.10
Q: A researcher would like to predic the dependert variable Y from the two independert variables X, and…
A: Given: N=18 α=0.01
Q: Using 25 observations on each variable, a computer program generated the following multiple…
A: Here it is required to test if the independent variable x1 is needed in the regression model. To…
Q: A simple linear regression analysis involving 20 observations produced SSR = 96.78 and SSE = 43.22.…
A:
Q: 4. Consider a multiple linear regression model with two independent variables with 12 values in each…
A:
Q: se multiple linear regression to calculate the coefficient of multiple determination and test…
A: From provided information, there are two independent variables as x1, x2 and dependent variable is…
Q: A researcher would like to predict the dependent variable YY from the two independent variables X1X1…
A:
Q: A researcher would like to predict the dependent variable Y from the two independent variables X1…
A: Step-by-step procedure to find the regression using Excel: In Excel sheet, enter X1, X2 in one…


Trending now
This is a popular solution!

Step by step
Solved in 2 steps

- Consider the multiple regression model shown next between the dependent variable Y and four independent variables X1, X2, X3, and X4, which results in the following function:Ŷ = 33 + 8X1 − 6X2 + 16X3 + 18X4For this model, there were 35 observations; SSR = 1,544 and SSE = 600. Assume a 0.01 significance level.Based on the given information, which of the following conclusions is correct about the statistical significance of the overall model? Multiple Choice Reject the null hypothesis that β3 = 0. Do not reject the null hypothesis that β1 = β2 = β3 = β4 = 0. Reject the null hypothesis that β1 = 0. Reject the null hypothesis that β1 = β2 = β3 = β4 = 0.A researcher would like to predict the dependent variable YY from the two independent variables X1X1 and X2X2 for a sample of N=20N=20 subjects. Use multiple linear regression to calculate the coefficient of multiple determination and test the significance of the overall regression model. Use a significance level α=0.05α=0.05. X1X1 X2X2 YY 65.4 65.8 57.3 72.8 70.8 55.1 63.3 59.9 66.9 59.1 60.4 60.4 65.4 66.9 56.2 58.3 61.9 50.4 57.1 57.1 54.2 78.2 62.5 67.5 54.2 55.9 57.1 56.5 55.5 57.8 57.9 56.2 60.8 54.3 54.8 61.8 68.2 70.5 71.8 60 64.1 58.8 66.6 60.5 54.6 66.7 68.5 51.7 45.1 48.6 57.1 58.4 59.9 55.9 58.6 66.3 52.5 56 60.5 67.1 SSreg=SSres=R2=F=P-value =A researcher would like to predict the dependent variable YY from the two independent variables X1X1 and X2X2for a sample of N=20N=20 subjects. Use multiple linear regression to calculate the coefficient of multiple determination and test the significance of the overall regression model. Use a significance level α=0.02. X1X1 X2X2 YY 31.4 32.3 25.2 85.4 28.1 53 66.3 42.6 67.4 59 56.1 70.7 52.4 40.4 39.7 86.4 23.7 35 50.9 36.7 34.4 74.4 38 64.9 57.3 47.6 67.4 61.9 33.3 41.3 48.6 49.7 53.6 46.6 47.2 34.5 31.8 38.7 40.9 86 55 74 69.8 27.7 45.9 65.8 48.2 42.4 44.7 55.3 55.1 57.3 27 31.5 60.4 28.1 19.4 65.9 26 13.7 SSreg= SSres= R2= F= P-value = What is your decision for the hypothesis test? Reject the null hypothesis, H0:β1=β2=0 Fail to reject H0H0 What is your final conclusion? The evidence supports the claim that one or more of the regression coefficients is non-zero The evidence supports the claim that all of the regression…
- A researcher would like to predict the dependent variable YY from the two independent variables X1X1 and X2X2 for a sample of N=10N=10 subjects. Use multiple linear regression to calculate the coefficient of multiple determination and test statistics to assess the significance of the regression model and partial slopes. Use a significance level α=0.01α=0.01. X1X1 X2X2 YY 58.8 29.9 63.1 64.1 57.3 40.1 51.4 35.3 46.2 77.1 88.5 30 60.6 67.5 16.2 68.3 63.4 62 44.8 6.6 77.6 49 29.3 65.5 55.5 25.8 62.5 57.5 30.2 62 R2=R2= F=F= P-value for overall model = t1=t1= for b1b1, P-value = t2=t2= for b2b2, P-value = What is your conclusion for the overall regression model (also called the omnibus test)? The overall regression model is statistically significant at α=0.01α=0.01. The overall regression model is not statistically significant at α=0.01α=0.01. Which of the regression coefficients are statistically different from zero? neither regression coefficient is…Which of the multivariate regression parameters listed below would be best interpreted as: the predicted value on the dependent variable when all of the independent variables in the model are equal to zero. a b1 X1 R2Ten observations were provided for a dependent variable y and two independent variables x1 and x2; for these data, SST = 15,189.8 and SSR = 14,056.9. (a) Compute R2. (Round your answer to three decimal places.) R2 = (b) Compute Ra2. (Round your answer to three decimal places.) Ra2 = (c) Does the estimated regression equation explain a large amount of the variability in the data? Explain. (For purposes of this exercise, consider an amount large if it is at least 55%. Round your answer to one decimal place.) , after adjusting for the number of independent variables in the model, we see that % of the variability in y has been accounted for.
- The following is a partial computer output of a multiple regression analysis of a data set containing 20 sets of observations on the dependent variableThe regression equation isSALEPRIC = 1470 + 0.814 LANDVAL + 0.820 IMPROVAL + 13.5 AREA Predictor Coef SE Coef T P Constant 1470 5746 0.26 0.801 LANDVAL 0.8145 0.5122 1.59 0.131 IMPROVAL 0.8204 0.2112 3.88 0.0001 AREA 13.529 6.586 2.05 0.057 S = 79190.48 R-Sq = 89.7% R-Sq(adj) = 87.8% Analysis of Variance Source DF SS MS Regression 3 8779676741 2926558914 Residual Error 16 1003491259 62718204 Total 19 9783168000 For the problem above, we want to carry out the significance test about the coefficient of LANDVAL, what is the t-value for this test, and is it significant? 46.66, significant 2.05, significant 1.59, not significant 0.26, not significantIf the standard error of the estimate for a regression model fitted to a large number of paired observations is 1.75, approximately 95% of the residuals would lie within ______. −3.50 and +3.50 −1.75 and +1.75 −0.95 and +0.95 −0.68 and +0.68 −0.97 and +0.97Years of Work Experience and number of Job Offers of 10 job-seekers were as follows: Work Exp. 4 2 5 3 7 12 2 5 4 9 No. of Offers 7 1 8 4 13 19 3 11 9 15 a. Fit the regression equation of No. of Job Offers on Years of Work Experience. b. What will be the predicted number of offers for an applicant with 6 years of experience? c. Verify the relationship between the number of job offers and years of work experience using at least two relevant methods
- Which regressors are meaningful at the 5% significance level according to the Minitab output given below for regression analysis? (n=12) A)Only x3 B)Only x1 C)x2 and x3 D)x1 and x2Calculate the R2of the following multivariate sample regression functions and interpret theanswers.3.1 Investment-hat = β1-hat + β2-hat*Interest rate + β3-hat*Exchange rateESS = 900RSS = 1003.2 Investment-hat = β1 + β2-hat*Interest rate + β3-hat*number of 311 studentsESS = 400RSS = 6003.3 Salary-hat = β1 + β2-hat*Frequency of blinking eyes + β3-hat*Colour of hairRSS = 950TSS = 1000Consider the following correlations -0.9 , -0.5 , -0.2 , 0 , 0.2 , 0.5 and 0.9. For each give the fraction of the variation in y that is explained by the least-squares regression of y on x.