Consolidated Balance Sheet $ millions, except par value Feb. 1, 2019 Current assets Cash and cash equivalents Short-term investments Merchandise inventory-net Other current assets Total current assets Property, less accumulated depreciation Long-term investments Deferred income taxes-net Goodwill Other assets Total assets Current liabilities Short-term borrowings Current maturities of long-term debt Accounts payable Accrued compensation and employee benefits Deferred revenue Other current liabilities Total current liabilities Long-term debt, excluding current maturities Deferred revenue-extended protection plans Other liabilities Total liabilities Shareholders equity Preferred stock-$5 par value, none issued Common stock-$0.50 par value Capital in excess of par value Retained earnings Accumulated other comprehensive loss Total shareholders' equity Total liabilities and shareholders equity $430 183 NOA S 10,570 789 11,972 15,511 215 247 255 837 $29,037 $608 934 6,967 557 1,093 2,041 12,200 12,110 696 967 25,973 335 2,905 (176) 3,064 $29,037 Identify and compute net operating assets (NOA) as of February 1, 2019. Assume that long-term investments are nonoperating Feb. 01, 2019 0
Consolidated Balance Sheet $ millions, except par value Feb. 1, 2019 Current assets Cash and cash equivalents Short-term investments Merchandise inventory-net Other current assets Total current assets Property, less accumulated depreciation Long-term investments Deferred income taxes-net Goodwill Other assets Total assets Current liabilities Short-term borrowings Current maturities of long-term debt Accounts payable Accrued compensation and employee benefits Deferred revenue Other current liabilities Total current liabilities Long-term debt, excluding current maturities Deferred revenue-extended protection plans Other liabilities Total liabilities Shareholders equity Preferred stock-$5 par value, none issued Common stock-$0.50 par value Capital in excess of par value Retained earnings Accumulated other comprehensive loss Total shareholders' equity Total liabilities and shareholders equity $430 183 NOA S 10,570 789 11,972 15,511 215 247 255 837 $29,037 $608 934 6,967 557 1,093 2,041 12,200 12,110 696 967 25,973 335 2,905 (176) 3,064 $29,037 Identify and compute net operating assets (NOA) as of February 1, 2019. Assume that long-term investments are nonoperating Feb. 01, 2019 0

Cornerstones of Financial Accounting
4th Edition
ISBN:9781337690881
Author:Jay Rich, Jeff Jones
Publisher:Jay Rich, Jeff Jones
Chapter12: Fainancial Statement Analysis
Section: Chapter Questions
Problem 75E

Related questions
Question
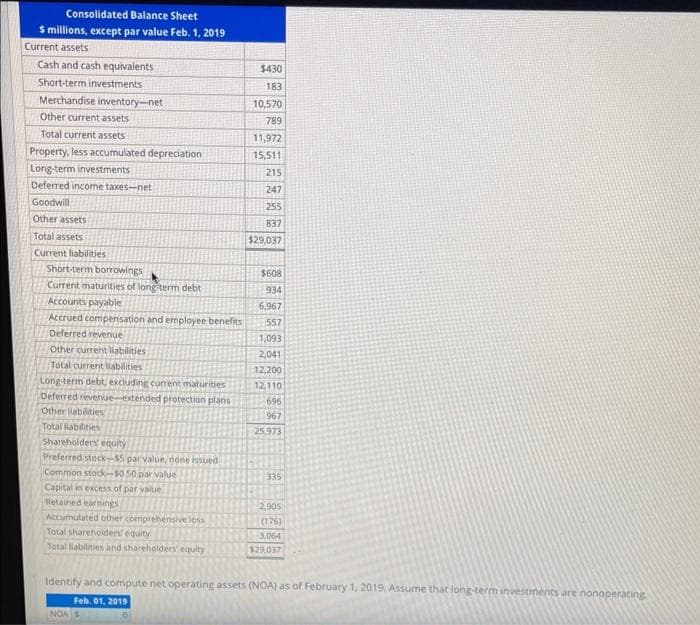
Transcribed Image Text:Consolidated Balance Sheet
$ millions, except par value Feb. 1, 2019
Current assets
Cash and cash equivalents
Short-term investments
Merchandise inventory-net
Other current assets
Total current assets
Property, less accumulated depreciation
Long-term investments
Deferred income taxes-net
Goodwill
Other assets
Total assets
Current liabilities
Short-term borrowings
Current maturities of long-term debt
Accounts payable
Accrued compensation and employee benefits
Deferred revenue
Other current liabilities
Total current liabilities
Long-term debt, excluding current maturities
Deferred revenue-extended protection plans
Other liabilities
Total liabilities
Shareholders equity
Preferred stock-$5 par value, none issued
Common stock-$0.50 par value
Capital in excess of par value
Retained earnings
Accumulated other comprehensive loss
Total shareholders' equity
Total liabilities and shareholders equity
$430
183
10,570
789
11,972
15,511
215
247
255
837
$29,037
NOA S
$608
934
6,967
557
1,093
2,041
12,200
12,110
696
967
25,973
335
2,905
(176)
3,064
$29,037
Identify and compute net operating assets (NOA) as of February 1, 2019. Assume that long-term investments are nonoperating
Feb. 01, 2019
0
Expert Solution
This question has been solved!
Explore an expertly crafted, step-by-step solution for a thorough understanding of key concepts.

This is a popular solution!

Trending now
This is a popular solution!

Step by step
Solved in 2 steps

Knowledge Booster


Learn more about
Need a deep-dive on the concept behind this application? Look no further. Learn more about this topic, accounting and related others by exploring similar questions and additional content below.Recommended textbooks for you
Cornerstones of Financial Accounting
Accounting
ISBN:
9781337690881
Author:
Jay Rich, Jeff Jones
Publisher:
Cengage Learning

Intermediate Accounting: Reporting And Analysis
Accounting
ISBN:
9781337788281
Author:
James M. Wahlen, Jefferson P. Jones, Donald Pagach
Publisher:
Cengage Learning
Cornerstones of Financial Accounting
Accounting
ISBN:
9781337690881
Author:
Jay Rich, Jeff Jones
Publisher:
Cengage Learning
Intermediate Accounting: Reporting And Analysis
Accounting
ISBN:
9781337788281
Author:
James M. Wahlen, Jefferson P. Jones, Donald Pagach
Publisher:
Cengage Learning