CONSOLIDATED BALANCE SHEETS GENERAL MILLS, INC. AND SUBSIDIARIES In Millions, Except Par Value May 29, 2016 May 28, 2017 ASSETS Current assets: Cash and cash equivalents $ 763.7 1,360.8 $ 766.1 Receivables 1,430.1 Inventories 1,483.6 1,413.7 Prepaid expenses and other current assets 381.6 399.0 Total current assets 4,061.4 3,937.2 Land, buildings, and equipment 3,687.7 3,743.6 8,741.2 Goodwill 8,747.2 Other intangible assets 4,530.4 4,538.6 Other assets 785.9 751.7 Total assets $ 21,812.6 $ 21,712.3 LIABILITIES AND EQUITY Current liabilities: Accounts payable $ 2,119.8 2,046.5 Current portion of long-term debt Notes payable 604.7 1,103.4 1,234.1 269.8 Other current liabilities 1,372.2 1,595.0 5,014.7 Total current liabilities 5,330.8 Long-term debt 7,642.9 7,057.7 Deferred income taxes 1,719.4 1,399.6 Other liabilities 1,523.1 2,087.6 Total liabilities 16,216.2 15,559.6 Redeemable interest 910.9 845.6 Stockholders' equity: Common stock, 754.6 shares issued, $0.10 par value Additional paid-in capital Retained earnings 75.5 75.5 1,120.9 1,177.0 13,138.9 12,616.5 (7,762.9) (2,244.5) (6,326.6) (2,612.2) Common stock in treasury, at cost, shares of 177.7 and 157.8 Accumulated other comprehensive loss Total stockholders' equity 4,327.9 4,930.2 Noncontrolling interests Total equity Total liabilities and equity 357.6 376.9 5,307.1 4,685.5 $ 21,712.3 $21,812.6 See accompanying notes to consolidated financial statements. Fiscal Year 2015 (a) In Millions, Except Per Share Data, Percentages and Ratios 2017 2016 2014 2013 CONSOLIDATED STATEMENTS OF EARNINGS Operating data: $ 17,630.3 $ 17,774.1 $15,619.8 $ 16,563.1 17,909.6 Net sales Gross margin b) Selling, general, and administrative expenses Operating profit Total segment operating profit (e Divestitures loss (gain) Net earnings attributable to General Mills Advertising and media expense Research and development expense 5,563.8 5,829.5 5,949.2 6,369.8 6,423.9 3,328.0 2,801.3 3,118.9 3,474.3 3,552.3 GENERAL MILLS, INC. AND SUBSIDIARIES 2,566.4 2,707.4 2,077.3 2,957.4 2,851.8 2,952.6 2,999.5 3,035.0 3,153.9 3,222.9 (148.2) (65.5) 13.5 Fiscal Year 1,657.5 1,697.4 1,221.3 1,824.4 1,855.2 In Millions, Except per Share Data 2017 2016 2015 754.4 623.8 823.1 869.5 895.0 $ 17,630.3 Net sales $ 15,619.8 $ 16,563.1 243.6 218.2 222.1 229.4 237.9 Cost of sales 10,056.0 10,733.6 11,681.1 Average shares outstanding: Selling, general, and administrative expenses Divestitures loss (gain) Restructuring, impairment, and other exit costs Operating profit 3,118.9 3,328.0 2,801.3 Diluted 598.0 611.9 618.8 645.7 665.6 (148.2) 13.5 Earnings per share: 182.6 151.4 543.9 $ $ Diluted 2.77 2.77 1.97 2.83 2.79 2,566.4 2,707.4 2,077.3 Diluted, excluding certain items affecting comparability $ Operating ratios: Gross margin as a percentage of net sales $ 3.08 2.92 $ 2.86 $ 2.82 2.72 $ Interest, net 295.1 303.8 315.4 Earnings before income taxes and after-tax earnings from joint ventures 2,271.3 2,403.6 1,761.9 35.6% 33.7% 35.2% 35.6% 36.1% 655.2 586.8 Income taxes 755.2 Selling, general, and administrative expenses as a After-tax earnings from joint ventures Net earnings, including earnings attributable to redeemable and noncontrolling interests Net earnings attributable to redeemable and noncontrolling interests 85.0 88.4 84.3 percentage of net sales Operating profit as a percentage of net sales Adjusted operating profit 19.4% 17.9% 18.8% 18.9% 20.0% 1,701.1 1,736.8 1,259.4 16.3% 11.8% 16.4% 16.5% 16.0% 43.6 39.4 38.1 $ 1,697.4 $ 1,657.5 Net earnings attribut able to General Mills 1,221.3 as a percentage of net sales (b) (c) Total segment operating profit 18.1% 16.8% 15.9% 16.2% 16.3% Earnings per share basic Earnings per share diluted Dividends per share $ 2.82 2.83 2.02 $ 2.77 2.77 1.97 $ as a percentage of net sales Effective income tax rate 18.9% 18.1% 17.2% 17.6% 18.1% $ 1.92 1.78 1.67 $ $ 28.8% 31.4% 33.3% 33.3% 29.2% See accompanying notes to consolidated financial statements. Return on average total capital 12.7% 12.9% 9.1% 12.5% 13.4% Adjusted return on average total capital b)e) 11.6% 11.3% 11.2% 11.6% 12.0% Balance sheet data: $ 3,687.7 Land, buildings, and equipment Total assets $3,743.6 $ 3,941.9 3,878.1 3,783.3 21,812.6 23,044.7 21,712.3 21,832.0 22,505.7 6,396.6 Long-term debt, excluding current portion 7,642.9 7,057.7 7,575.3 5,901.8 CONSOLIDATED STATEMENTS OF COMPREHENSIVE INCOME Total debt (b) 9,481.7 8,430.9 9,191.5 8,758.9 7,944.8 Cash flow data: $ 2,313.3 $ 2,542.8 712.4 $ 2,926.0 613.9 $ 2,629.8 $ 2,541.0 Net cash provided by operating activities Capital expenditures Free cash flow (b) (e) GENERAL MILLS, INC. AND SUBSIDIARIES 729.3 684.4 663.5 1,628.9 1,900.5 1,830.4 1,877.5 2,312.1 Fixed charge coverage ratio () Operating cash flow to debt ratio (b) 7.26 7.40 5.54 8.04 7.62 Fiscal Year 24.4% 31.2% 27.7% 29.0% 36.8% 2016 In Millions 2017 2015 Share data: $ 1,701.1 $ 1,259.4 1,736.8 Net earnings, including earnings attributable to redeemable and noncontrolling interests Other comprehensive income (loss), net of tax: Foreign currency translation Net actuarial income (loss) Low stock price $ $ 55.91 54.12 48.86 46.86 37.55 High stock price Closing stock price 72.64 65.36 57.14 54.40 50.93 (957.9) (358.4) (108.7) (325.9) 6.3 57.32 62.87 56.15 53.81 48.98 197.9 Cash dividends per common share 1.92 1.78 1.67 1.55 1.32 Other fair value changes: Number of full- and part-time employees 38,000 39,000 42,000 43,000 41,000 Securities 0.8 0.1 0.8 Hedge derivatives Reclassification to earnings: Hedge derivatives 53.3 16.0 4.1 (25.7) (9.5) 4.9 Amortization of losses and prior service costs Other comprehensive income (loss), net of tax Total comprehensive income Comprehensive income (loss) attributable to redeemable 122.5 128.6 105.1 (299.4) (1,201.4) 355.1 2,056.2 1,437.4 58.0 (192.9) and noncontrolling interests Comprehensive income attributable to General Mills 31.0 41.5 $ 2,025.2 1,395.9 250.9 See accompanying notes to consolidated financial statements.
CONSOLIDATED BALANCE SHEETS GENERAL MILLS, INC. AND SUBSIDIARIES In Millions, Except Par Value May 29, 2016 May 28, 2017 ASSETS Current assets: Cash and cash equivalents $ 763.7 1,360.8 $ 766.1 Receivables 1,430.1 Inventories 1,483.6 1,413.7 Prepaid expenses and other current assets 381.6 399.0 Total current assets 4,061.4 3,937.2 Land, buildings, and equipment 3,687.7 3,743.6 8,741.2 Goodwill 8,747.2 Other intangible assets 4,530.4 4,538.6 Other assets 785.9 751.7 Total assets $ 21,812.6 $ 21,712.3 LIABILITIES AND EQUITY Current liabilities: Accounts payable $ 2,119.8 2,046.5 Current portion of long-term debt Notes payable 604.7 1,103.4 1,234.1 269.8 Other current liabilities 1,372.2 1,595.0 5,014.7 Total current liabilities 5,330.8 Long-term debt 7,642.9 7,057.7 Deferred income taxes 1,719.4 1,399.6 Other liabilities 1,523.1 2,087.6 Total liabilities 16,216.2 15,559.6 Redeemable interest 910.9 845.6 Stockholders' equity: Common stock, 754.6 shares issued, $0.10 par value Additional paid-in capital Retained earnings 75.5 75.5 1,120.9 1,177.0 13,138.9 12,616.5 (7,762.9) (2,244.5) (6,326.6) (2,612.2) Common stock in treasury, at cost, shares of 177.7 and 157.8 Accumulated other comprehensive loss Total stockholders' equity 4,327.9 4,930.2 Noncontrolling interests Total equity Total liabilities and equity 357.6 376.9 5,307.1 4,685.5 $ 21,712.3 $21,812.6 See accompanying notes to consolidated financial statements. Fiscal Year 2015 (a) In Millions, Except Per Share Data, Percentages and Ratios 2017 2016 2014 2013 CONSOLIDATED STATEMENTS OF EARNINGS Operating data: $ 17,630.3 $ 17,774.1 $15,619.8 $ 16,563.1 17,909.6 Net sales Gross margin b) Selling, general, and administrative expenses Operating profit Total segment operating profit (e Divestitures loss (gain) Net earnings attributable to General Mills Advertising and media expense Research and development expense 5,563.8 5,829.5 5,949.2 6,369.8 6,423.9 3,328.0 2,801.3 3,118.9 3,474.3 3,552.3 GENERAL MILLS, INC. AND SUBSIDIARIES 2,566.4 2,707.4 2,077.3 2,957.4 2,851.8 2,952.6 2,999.5 3,035.0 3,153.9 3,222.9 (148.2) (65.5) 13.5 Fiscal Year 1,657.5 1,697.4 1,221.3 1,824.4 1,855.2 In Millions, Except per Share Data 2017 2016 2015 754.4 623.8 823.1 869.5 895.0 $ 17,630.3 Net sales $ 15,619.8 $ 16,563.1 243.6 218.2 222.1 229.4 237.9 Cost of sales 10,056.0 10,733.6 11,681.1 Average shares outstanding: Selling, general, and administrative expenses Divestitures loss (gain) Restructuring, impairment, and other exit costs Operating profit 3,118.9 3,328.0 2,801.3 Diluted 598.0 611.9 618.8 645.7 665.6 (148.2) 13.5 Earnings per share: 182.6 151.4 543.9 $ $ Diluted 2.77 2.77 1.97 2.83 2.79 2,566.4 2,707.4 2,077.3 Diluted, excluding certain items affecting comparability $ Operating ratios: Gross margin as a percentage of net sales $ 3.08 2.92 $ 2.86 $ 2.82 2.72 $ Interest, net 295.1 303.8 315.4 Earnings before income taxes and after-tax earnings from joint ventures 2,271.3 2,403.6 1,761.9 35.6% 33.7% 35.2% 35.6% 36.1% 655.2 586.8 Income taxes 755.2 Selling, general, and administrative expenses as a After-tax earnings from joint ventures Net earnings, including earnings attributable to redeemable and noncontrolling interests Net earnings attributable to redeemable and noncontrolling interests 85.0 88.4 84.3 percentage of net sales Operating profit as a percentage of net sales Adjusted operating profit 19.4% 17.9% 18.8% 18.9% 20.0% 1,701.1 1,736.8 1,259.4 16.3% 11.8% 16.4% 16.5% 16.0% 43.6 39.4 38.1 $ 1,697.4 $ 1,657.5 Net earnings attribut able to General Mills 1,221.3 as a percentage of net sales (b) (c) Total segment operating profit 18.1% 16.8% 15.9% 16.2% 16.3% Earnings per share basic Earnings per share diluted Dividends per share $ 2.82 2.83 2.02 $ 2.77 2.77 1.97 $ as a percentage of net sales Effective income tax rate 18.9% 18.1% 17.2% 17.6% 18.1% $ 1.92 1.78 1.67 $ $ 28.8% 31.4% 33.3% 33.3% 29.2% See accompanying notes to consolidated financial statements. Return on average total capital 12.7% 12.9% 9.1% 12.5% 13.4% Adjusted return on average total capital b)e) 11.6% 11.3% 11.2% 11.6% 12.0% Balance sheet data: $ 3,687.7 Land, buildings, and equipment Total assets $3,743.6 $ 3,941.9 3,878.1 3,783.3 21,812.6 23,044.7 21,712.3 21,832.0 22,505.7 6,396.6 Long-term debt, excluding current portion 7,642.9 7,057.7 7,575.3 5,901.8 CONSOLIDATED STATEMENTS OF COMPREHENSIVE INCOME Total debt (b) 9,481.7 8,430.9 9,191.5 8,758.9 7,944.8 Cash flow data: $ 2,313.3 $ 2,542.8 712.4 $ 2,926.0 613.9 $ 2,629.8 $ 2,541.0 Net cash provided by operating activities Capital expenditures Free cash flow (b) (e) GENERAL MILLS, INC. AND SUBSIDIARIES 729.3 684.4 663.5 1,628.9 1,900.5 1,830.4 1,877.5 2,312.1 Fixed charge coverage ratio () Operating cash flow to debt ratio (b) 7.26 7.40 5.54 8.04 7.62 Fiscal Year 24.4% 31.2% 27.7% 29.0% 36.8% 2016 In Millions 2017 2015 Share data: $ 1,701.1 $ 1,259.4 1,736.8 Net earnings, including earnings attributable to redeemable and noncontrolling interests Other comprehensive income (loss), net of tax: Foreign currency translation Net actuarial income (loss) Low stock price $ $ 55.91 54.12 48.86 46.86 37.55 High stock price Closing stock price 72.64 65.36 57.14 54.40 50.93 (957.9) (358.4) (108.7) (325.9) 6.3 57.32 62.87 56.15 53.81 48.98 197.9 Cash dividends per common share 1.92 1.78 1.67 1.55 1.32 Other fair value changes: Number of full- and part-time employees 38,000 39,000 42,000 43,000 41,000 Securities 0.8 0.1 0.8 Hedge derivatives Reclassification to earnings: Hedge derivatives 53.3 16.0 4.1 (25.7) (9.5) 4.9 Amortization of losses and prior service costs Other comprehensive income (loss), net of tax Total comprehensive income Comprehensive income (loss) attributable to redeemable 122.5 128.6 105.1 (299.4) (1,201.4) 355.1 2,056.2 1,437.4 58.0 (192.9) and noncontrolling interests Comprehensive income attributable to General Mills 31.0 41.5 $ 2,025.2 1,395.9 250.9 See accompanying notes to consolidated financial statements.

Financial Accounting: The Impact on Decision Makers
10th Edition
ISBN:9781305654174
Author:Gary A. Porter, Curtis L. Norton
Publisher:Gary A. Porter, Curtis L. Norton
Chapter13: Financial Statement Analysis
Section: Chapter Questions
Problem 13.10E

Related questions
Question
I need assistance calculating ratios with the attached income statement and balance sheet:
| Fiscal 2017 | Fiscal 2016 | |
| Gross margin, as reported | 35.6% | 35.2% |
| Mark-to-market effects | (0.1) | (0.4) |
| Restructuring costs | 0.3 | 0.5 |
| Project-related costs | 0.3 | 0.3 |
| Adjusted gross margin | 36.1% | 35.6% |
Calculate the following financial ratios for 2016 and 2017
4. Reutrn on assets (2015, total assets = $21,932.0 million)
5. Return on common
6.
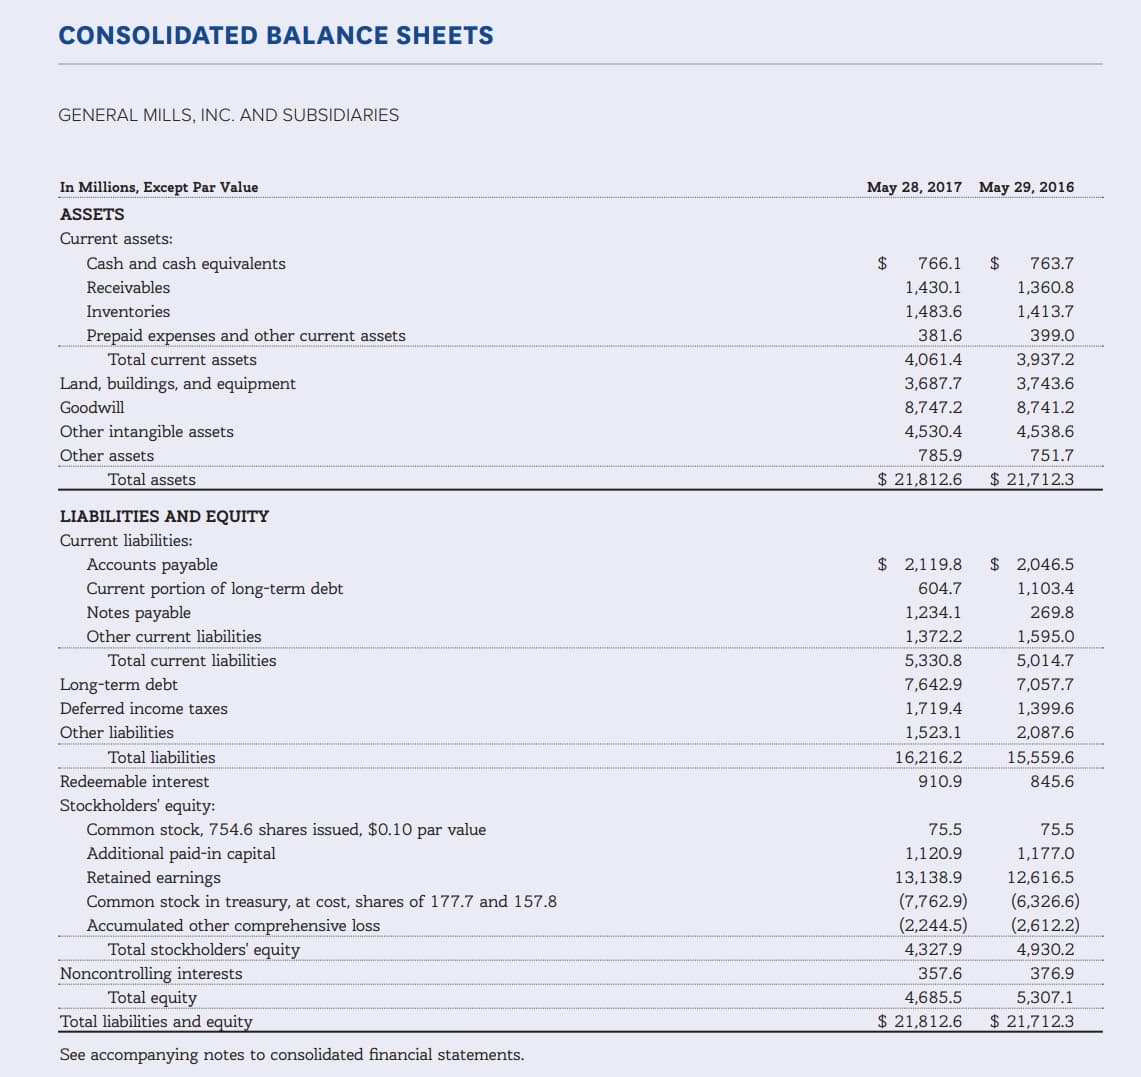
Transcribed Image Text:CONSOLIDATED BALANCE SHEETS
GENERAL MILLS, INC. AND SUBSIDIARIES
In Millions, Except Par Value
May 29, 2016
May 28, 2017
ASSETS
Current assets:
Cash and cash equivalents
$
763.7
1,360.8
$
766.1
Receivables
1,430.1
Inventories
1,483.6
1,413.7
Prepaid expenses and other current assets
381.6
399.0
Total current assets
4,061.4
3,937.2
Land, buildings, and equipment
3,687.7
3,743.6
8,741.2
Goodwill
8,747.2
Other intangible assets
4,530.4
4,538.6
Other assets
785.9
751.7
Total assets
$ 21,812.6
$ 21,712.3
LIABILITIES AND EQUITY
Current liabilities:
Accounts payable
$ 2,119.8
2,046.5
Current portion of long-term debt
Notes payable
604.7
1,103.4
1,234.1
269.8
Other current liabilities
1,372.2
1,595.0
5,014.7
Total current liabilities
5,330.8
Long-term debt
7,642.9
7,057.7
Deferred income taxes
1,719.4
1,399.6
Other liabilities
1,523.1
2,087.6
Total liabilities
16,216.2
15,559.6
Redeemable interest
910.9
845.6
Stockholders' equity:
Common stock, 754.6 shares issued, $0.10 par value
Additional paid-in capital
Retained earnings
75.5
75.5
1,120.9
1,177.0
13,138.9
12,616.5
(7,762.9)
(2,244.5)
(6,326.6)
(2,612.2)
Common stock in treasury, at cost, shares of 177.7 and 157.8
Accumulated other comprehensive loss
Total stockholders' equity
4,327.9
4,930.2
Noncontrolling interests
Total equity
Total liabilities and equity
357.6
376.9
5,307.1
4,685.5
$ 21,712.3
$21,812.6
See accompanying notes to consolidated financial statements.
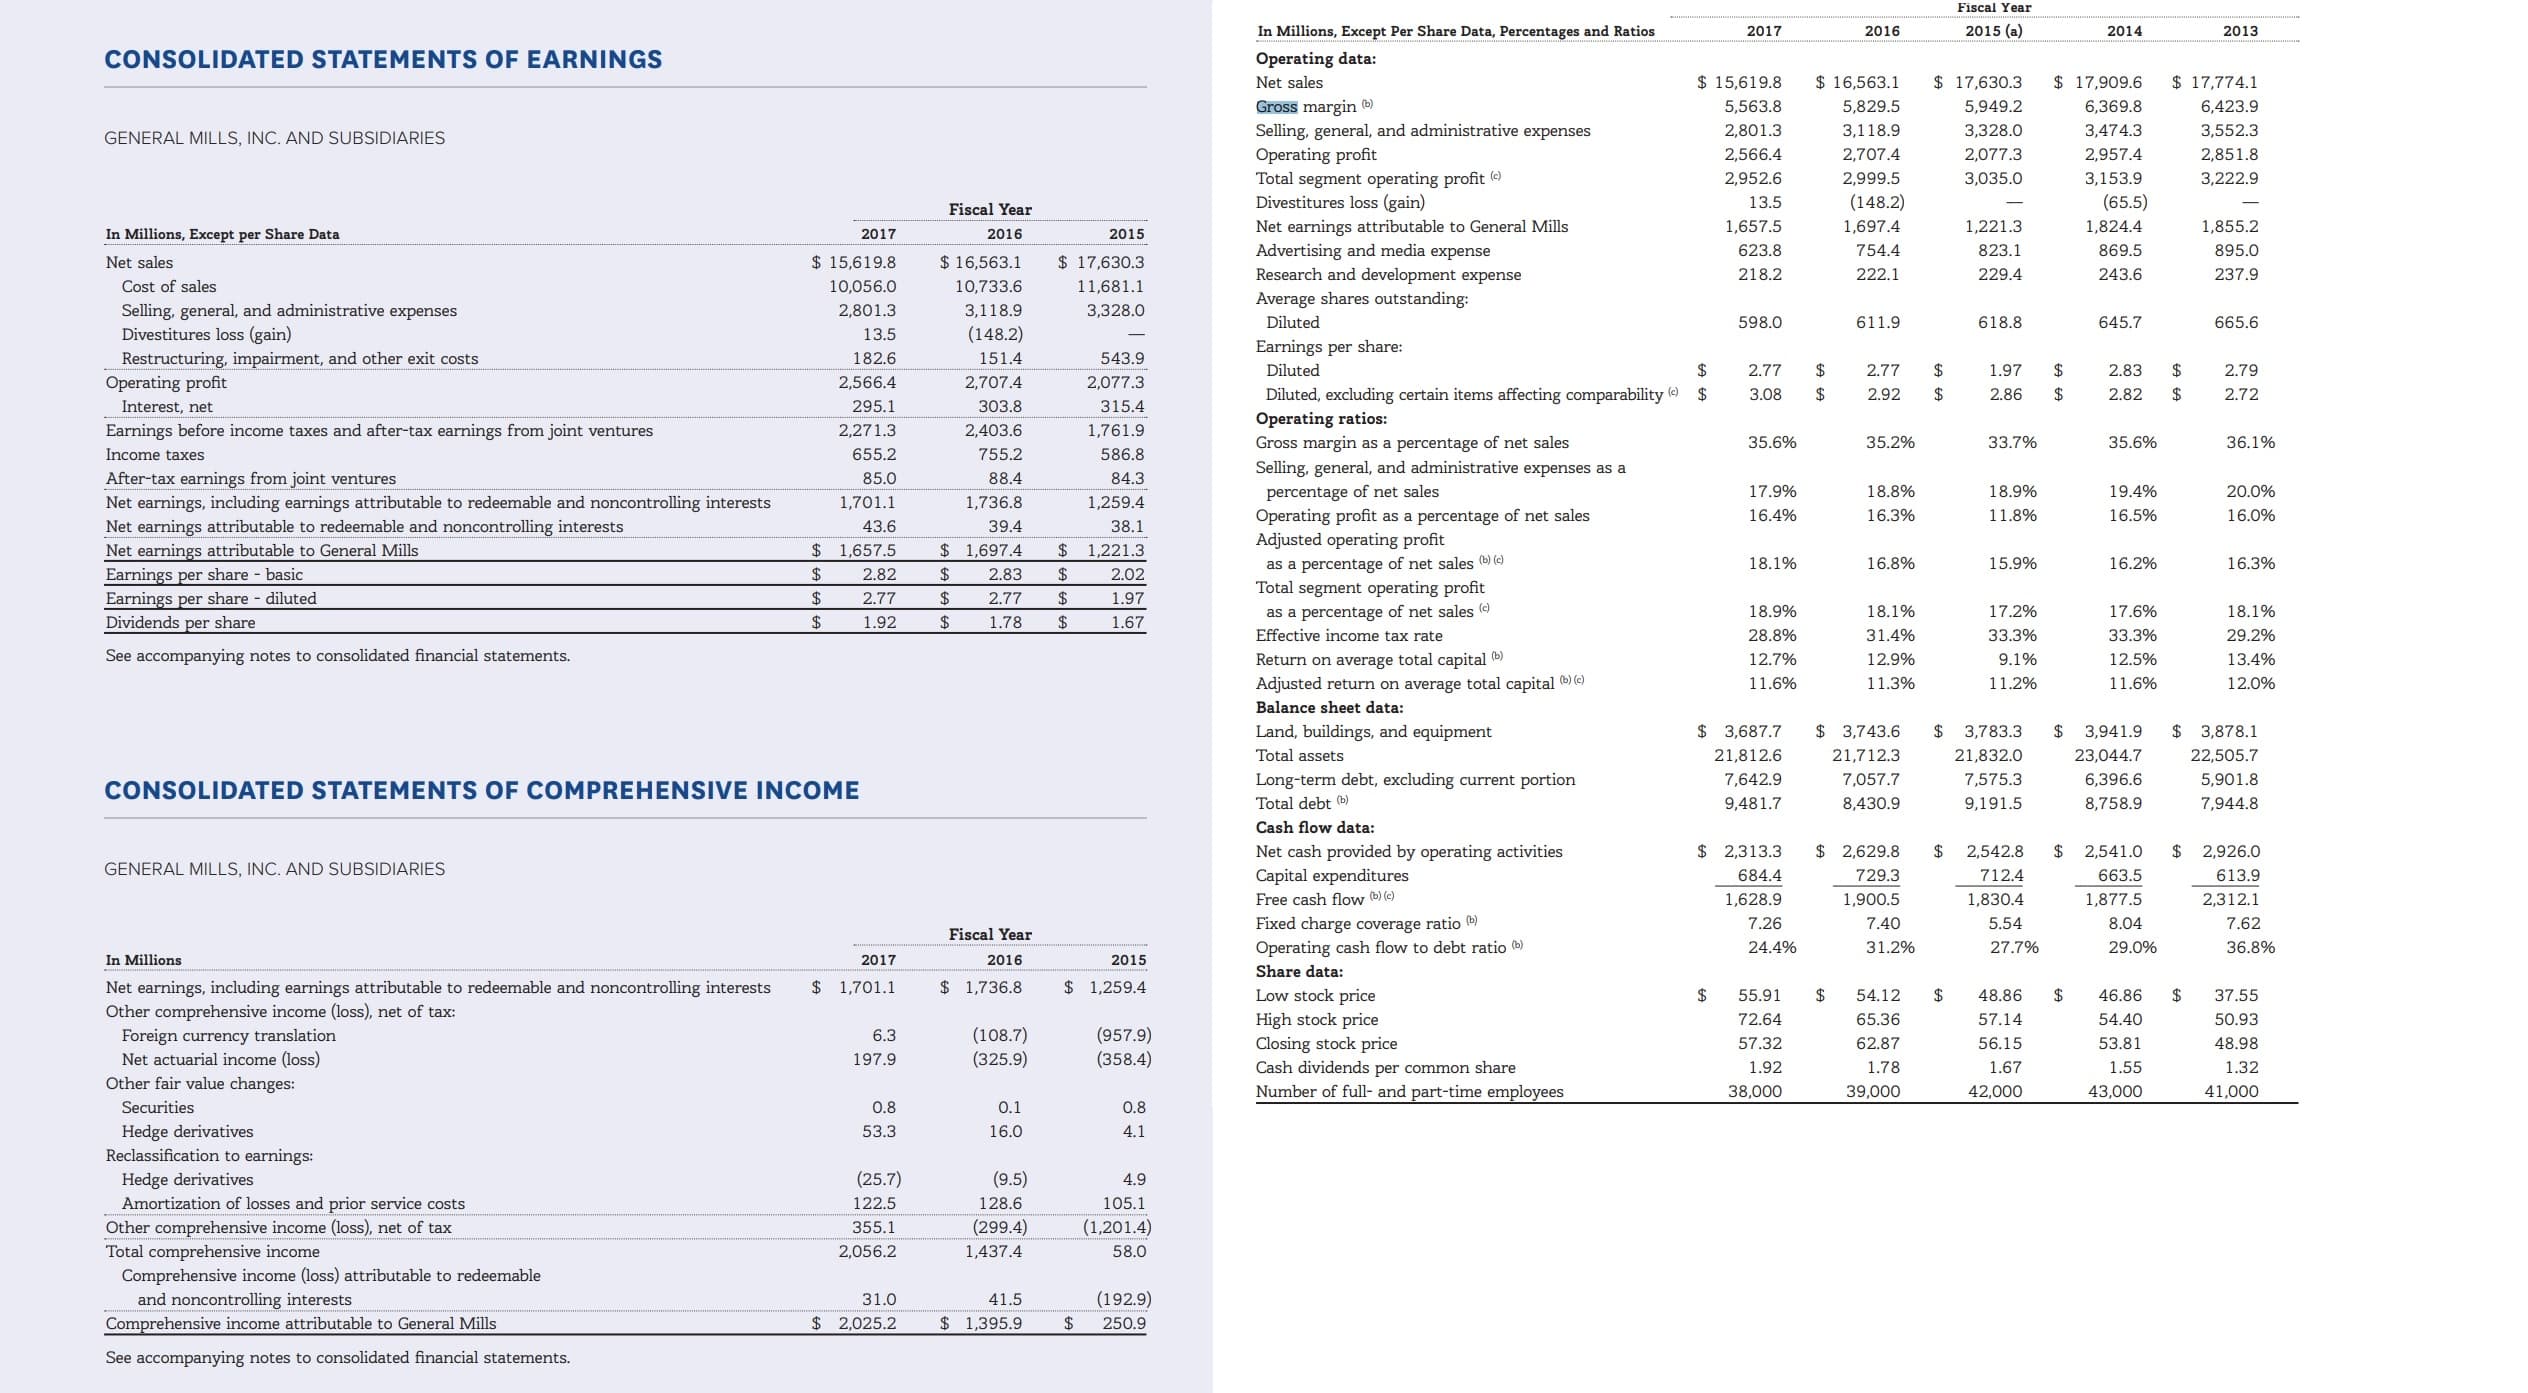
Transcribed Image Text:Fiscal Year
2015 (a)
In Millions, Except Per Share Data, Percentages and Ratios
2017
2016
2014
2013
CONSOLIDATED STATEMENTS OF EARNINGS
Operating data:
$ 17,630.3
$ 17,774.1
$15,619.8
$ 16,563.1
17,909.6
Net sales
Gross margin b)
Selling, general, and administrative expenses
Operating profit
Total segment operating profit (e
Divestitures loss (gain)
Net earnings attributable to General Mills
Advertising and media expense
Research and development expense
5,563.8
5,829.5
5,949.2
6,369.8
6,423.9
3,328.0
2,801.3
3,118.9
3,474.3
3,552.3
GENERAL MILLS, INC. AND SUBSIDIARIES
2,566.4
2,707.4
2,077.3
2,957.4
2,851.8
2,952.6
2,999.5
3,035.0
3,153.9
3,222.9
(148.2)
(65.5)
13.5
Fiscal Year
1,657.5
1,697.4
1,221.3
1,824.4
1,855.2
In Millions, Except per Share Data
2017
2016
2015
754.4
623.8
823.1
869.5
895.0
$ 17,630.3
Net sales
$ 15,619.8
$ 16,563.1
243.6
218.2
222.1
229.4
237.9
Cost of sales
10,056.0
10,733.6
11,681.1
Average shares outstanding:
Selling, general, and administrative expenses
Divestitures loss (gain)
Restructuring, impairment, and other exit costs
Operating profit
3,118.9
3,328.0
2,801.3
Diluted
598.0
611.9
618.8
645.7
665.6
(148.2)
13.5
Earnings per share:
182.6
151.4
543.9
$
$
Diluted
2.77
2.77
1.97
2.83
2.79
2,566.4
2,707.4
2,077.3
Diluted, excluding certain items affecting comparability $
Operating ratios:
Gross margin as a percentage of net sales
$
3.08
2.92
$
2.86
$
2.82
2.72
$
Interest, net
295.1
303.8
315.4
Earnings before income taxes and after-tax earnings from joint ventures
2,271.3
2,403.6
1,761.9
35.6%
33.7%
35.2%
35.6%
36.1%
655.2
586.8
Income taxes
755.2
Selling, general, and administrative expenses as a
After-tax earnings from joint ventures
Net earnings, including earnings attributable to redeemable and noncontrolling interests
Net earnings attributable to redeemable and noncontrolling interests
85.0
88.4
84.3
percentage of net sales
Operating profit as a percentage of net sales
Adjusted operating profit
19.4%
17.9%
18.8%
18.9%
20.0%
1,701.1
1,736.8
1,259.4
16.3%
11.8%
16.4%
16.5%
16.0%
43.6
39.4
38.1
$ 1,697.4
$ 1,657.5
Net earnings attribut able to General Mills
1,221.3
as a percentage of net sales (b) (c)
Total segment operating profit
18.1%
16.8%
15.9%
16.2%
16.3%
Earnings per share basic
Earnings per share diluted
Dividends per share
$
2.82
2.83
2.02
$
2.77
2.77
1.97
$
as a percentage of net sales
Effective income tax rate
18.9%
18.1%
17.2%
17.6%
18.1%
$
1.92
1.78
1.67
$
$
28.8%
31.4%
33.3%
33.3%
29.2%
See accompanying notes to consolidated financial statements.
Return on average total capital
12.7%
12.9%
9.1%
12.5%
13.4%
Adjusted return on average total capital b)e)
11.6%
11.3%
11.2%
11.6%
12.0%
Balance sheet data:
$ 3,687.7
Land, buildings, and equipment
Total assets
$3,743.6
$
3,941.9
3,878.1
3,783.3
21,812.6
23,044.7
21,712.3
21,832.0
22,505.7
6,396.6
Long-term debt, excluding current portion
7,642.9
7,057.7
7,575.3
5,901.8
CONSOLIDATED STATEMENTS OF COMPREHENSIVE INCOME
Total debt (b)
9,481.7
8,430.9
9,191.5
8,758.9
7,944.8
Cash flow data:
$ 2,313.3
$
2,542.8
712.4
$
2,926.0
613.9
$ 2,629.8
$ 2,541.0
Net cash provided by operating activities
Capital expenditures
Free cash flow (b) (e)
GENERAL MILLS, INC. AND SUBSIDIARIES
729.3
684.4
663.5
1,628.9
1,900.5
1,830.4
1,877.5
2,312.1
Fixed charge coverage ratio ()
Operating cash flow to debt ratio (b)
7.26
7.40
5.54
8.04
7.62
Fiscal Year
24.4%
31.2%
27.7%
29.0%
36.8%
2016
In Millions
2017
2015
Share data:
$ 1,701.1
$ 1,259.4
1,736.8
Net earnings, including earnings attributable to redeemable and noncontrolling interests
Other comprehensive income (loss), net of tax:
Foreign currency translation
Net actuarial income (loss)
Low stock price
$
$
55.91
54.12
48.86
46.86
37.55
High stock price
Closing stock price
72.64
65.36
57.14
54.40
50.93
(957.9)
(358.4)
(108.7)
(325.9)
6.3
57.32
62.87
56.15
53.81
48.98
197.9
Cash dividends per common share
1.92
1.78
1.67
1.55
1.32
Other fair value changes:
Number of full- and part-time employees
38,000
39,000
42,000
43,000
41,000
Securities
0.8
0.1
0.8
Hedge derivatives
Reclassification to earnings:
Hedge derivatives
53.3
16.0
4.1
(25.7)
(9.5)
4.9
Amortization of losses and prior service costs
Other comprehensive income (loss), net of tax
Total comprehensive income
Comprehensive income (loss) attributable to redeemable
122.5
128.6
105.1
(299.4)
(1,201.4)
355.1
2,056.2
1,437.4
58.0
(192.9)
and noncontrolling interests
Comprehensive income attributable to General Mills
31.0
41.5
$ 2,025.2
1,395.9
250.9
See accompanying notes to consolidated financial statements.
Expert Solution
This question has been solved!
Explore an expertly crafted, step-by-step solution for a thorough understanding of key concepts.

This is a popular solution!

Trending now
This is a popular solution!

Step by step
Solved in 6 steps with 6 images

Knowledge Booster


Learn more about
Need a deep-dive on the concept behind this application? Look no further. Learn more about this topic, accounting and related others by exploring similar questions and additional content below.Recommended textbooks for you
Financial Accounting: The Impact on Decision Make…
Accounting
ISBN:
9781305654174
Author:
Gary A. Porter, Curtis L. Norton
Publisher:
Cengage Learning

Cornerstones of Financial Accounting
Accounting
ISBN:
9781337690881
Author:
Jay Rich, Jeff Jones
Publisher:
Cengage Learning
Financial Accounting: The Impact on Decision Make…
Accounting
ISBN:
9781305654174
Author:
Gary A. Porter, Curtis L. Norton
Publisher:
Cengage Learning
Cornerstones of Financial Accounting
Accounting
ISBN:
9781337690881
Author:
Jay Rich, Jeff Jones
Publisher:
Cengage Learning