CONSOLIDATED BALANCE SHEETS May 28, 2017 May 29, 2016 Net sales by class of similar products were as follows: In Millions Inventories: Fiscal Year GENERAL MILLS, INC. AND SUBSIDIARIES Raw materials and packaging Finished goods In Millions 2017 2016 2015 395.4 397.3 1,224.3 1,163.1 $ 3,302.2 $ 3,297.2 $ 3,392.0 Snacks Grain 73.0 72.6 Cereal 2,673.2 2,731.5 2,771.3 (209.1) 1,483.6 $1,413.7 (219.3) In Millions, Except Par Value May 29, 2016 Excess of FIFO over LIFO cost (a) May 28, 2017 Convenient meals 2,653.6 2,779.0 2,810.3 Total Yogurt Dough Baking mixes and ingredients 1,654.1 Super-premium ice cream 2,403.5 2,760.9 2,938.3 ASSETS (a) Inventories of $893.8 million as of May 28, 2017, and $8410 million as of May 29, 2016, were valued at LIFO. The difference between replacement cost and the stated LIFO inventory value is not materially different from the reserve for the LIFO valuation method. 1,690.6 1,820.0 1,877.0 Current assets: 1,867.7 1,704.3 Cash and cash equivalents $ 763.7 1,360.8 $ 766.1 738.4 731.2 769.5 Receivables 1,430.1 Vegetables 310.5 532.3 937.3 Мay 29, 2016 Inventories 1,483.6 1,413.7 Мay 28, 2017 Other 193.7 206.7 266.9 In Millions $15,619.8 $16,563.1 $17,630.3 Total Prepaid expenses and other current assets 381.6 399.0 Prepaid expenses and other current assets: Total current assets 4,061.4 3,937.2 163.7 Other receivables 159.3 The following table provides financial information by geographic area: Land, buildings, and equipment 3,687.7 3,743.6 Prepaid expenses 168.9 177.9 Goodwill 8,747.2 8,741.2 Derivative receivables, primarily commodity-related Grain contracts Other intangible assets 35.0 44.6 4,530.4 4,538.6 Fiscal Year 2.7 1.8 In Millions 2017 2016 2015 Other assets 785.9 751.7 Miscellaneous 11.3 15.4 Net sales: Total assets $ 21,812.6 $ 21,712.3 381.6 $ Total 399.0 $11,160.9 $11,930.9 $12,501.8 United States 4,632.2 LIABILITIES AND EQUITY Non-United States 4,458.9 5,128.5 May 28, 2017 Мay 29, 2016 $15,619.8 $16,563.1 $17,630.3 Total In Millions Current liabilities: Land, buildings, and equipment Accounts payable $ 2,119.8 2,046.5 Мay 28, 2017 May 29, 2016 $ Land 79.8 92.9 In Millions Current portion of long-term debt Notes payable 604.7 1,103.4 2,236.0 Buildings Buildings under capital lease Equipment Equipment under capital lease Capitalized software Construction in progress Total land, buildings, and equipment Less accumulated depreciation 2,249.2 Cash and cash equivalents: 1,234.1 269.8 0.3 0.3 United States $ 62.9 $ 118.5 Other current liabilities 1,372.2 1,595.0 6,095.9 5,945.6 Non-United States 703.2 645.2 Total current liabilities 5,330.8 5,014.7 3.0 3.0 Total 766.1 763.7 Long-term debt 7,057.7 7,642.9 545.4 523.0 553.0 702.7 Мay 28, 2017 Deferred income taxes 1,719.4 1,399.6 Мay 29, 2016 In Millions 9,526.6 9,503.5 Other liabilities 2,087.6 1,523.1 Land, buildings, and equipment: (5,838.9) (5,759.9) Total liabilities 16,216.2 15,559.6 $ 2,704.0 $ 2,755.1 Total 3,687.7 3,743.6 United States Redeemable interest 910.9 845.6 Non-United States 983.7 988.5 May 28, 2017 May 29, 2016 Stockholders' equity: $ 3,687.7 $ 3,743.6 Total In Millions Common stock, 754.6 shares issued, $0.10 par value Additional paid-in capital 75.5 75.5 Other assets: 1,120.9 1,177.0 Investments in and advances NOTE 17. SUPPLEMENTAL INFORMATION Retained earnings 13,138.9 12,616.5 505.3 $ to joint ventures 518.9 (6,326.6) (2,612.2) Pension assets (7,762.9) 144.9 90.9 Common stock in treasury, at cost, shares of 177.7 and 157.8 The components of certain Consolidated Balance Sheet accounts are as follows: Exchangeable note with related party 12.7 (2,244.5) Accumulated other comprehensive loss Total stockholders' equity Life insurance 25.6 26.3 4,327.9 4,930.2 Miscellaneous 110.1 102.9 Noncontrolling interests Total equity Total liabilities and equity Мay 28, 2017 357.6 376.9 May 29, 2016 Total 785.9 751.7 In Millions 4,685.5 5,307.1 Receivables: $ 21,712.3 $21,812.6 $ 1,454.4 (24.3) $ 1,430.1 $ 1,360.8 $ 1,390.4 Customers (29.6) Less allowance for doubtful accounts See accompanying notes to consolidated financial statements. Total Fiscal Year 2015 (a) In Millions, Except Per Share Data, Percentages and Ratios 2017 2016 2014 2013 CONSOLIDATED STATEMENTS OF EARNINGS Operating data: $ 17,630.3 $ 17,774.1 $15,619.8 $ 16,563.1 17,909.6 Net sales Gross margin b) Selling, general, and administrative expenses Operating profit Total segment operating profit (e Divestitures loss (gain) Net earnings attributable to General Mills Advertising and media expense Research and development expense 5,563.8 5,829.5 5,949.2 6,369.8 6,423.9 3,328.0 2,801.3 3,118.9 3,474.3 3,552.3 GENERAL MILLS, INC. AND SUBSIDIARIES 2,566.4 2,707.4 2,077.3 2,957.4 2,851.8 2,952.6 2,999.5 3,035.0 3,153.9 3,222.9 (148.2) (65.5) 13.5 Fiscal Year 1,657.5 1,697.4 1,221.3 1,824.4 1,855.2 In Millions, Except per Share Data 2017 2016 2015 754.4 623.8 823.1 869.5 895.0 $ 17,630.3 Net sales $ 15,619.8 $ 16,563.1 243.6 218.2 222.1 229.4 237.9 Cost of sales 10,056.0 10,733.6 11,681.1 Average shares outstanding: Selling, general, and administrative expenses Divestitures loss (gain) Restructuring, impairment, and other exit costs Operating profit 3,118.9 3,328.0 2,801.3 Diluted 598.0 611.9 618.8 645.7 665.6 (148.2) 13.5 Earnings per share: 182.6 151.4 543.9 $ $ Diluted 2.77 2.77 1.97 2.83 2.79 2,566.4 2,707.4 2,077.3 Diluted, excluding certain items affecting comparability $ Operating ratios: Gross margin as a percentage of net sales $ 3.08 2.92 $ 2.86 $ 2.82 2.72 $ Interest, net 295.1 303.8 315.4 Earnings before income taxes and after-tax earnings from joint ventures 2,271.3 2,403.6 1,761.9 35.6% 33.7% 35.2% 35.6% 36.1% 655.2 586.8 Income taxes 755.2 Selling, general, and administrative expenses as a After-tax earnings from joint ventures Net earnings, including earnings attributable to redeemable and noncontrolling interests Net earnings attributable to redeemable and noncontrolling interests 85.0 88.4 84.3 percentage of net sales Operating profit as a percentage of net sales Adjusted operating profit 19.4% 17.9% 18.8% 18.9% 20.0% 1,701.1 1,736.8 1,259.4 16.3% 11.8% 16.4% 16.5% 16.0% 43.6 39.4 38.1 $ 1,697.4 $ 1,657.5 Net earnings attribut able to General Mills 1,221.3 as a percentage of net sales (b) (c) Total segment operating profit 18.1% 16.8% 15.9% 16.2% 16.3% Earnings per share basic Earnings per share diluted Dividends per share $ 2.82 2.83 2.02 $ 2.77 2.77 1.97 $ as a percentage of net sales Effective income tax rate 18.9% 18.1% 17.2% 17.6% 18.1% $ 1.92 1.78 1.67 $ $ 28.8% 31.4% 33.3% 33.3% 29.2% See accompanying notes to consolidated financial statements. Return on average total capital 12.7% 12.9% 9.1% 12.5% 13.4% Adjusted return on average total capital b)e) 11.6% 11.3% 11.2% 11.6% 12.0% Balance sheet data: $ 3,687.7 Land, buildings, and equipment Total assets $3,743.6 $ 3,941.9 3,878.1 3,783.3 21,812.6 23,044.7 21,712.3 21,832.0 22,505.7 6,396.6 Long-term debt, excluding current portion 7,642.9 7,057.7 7,575.3 5,901.8 CONSOLIDATED STATEMENTS OF COMPREHENSIVE INCOME Total debt (b) 9,481.7 8,430.9 9,191.5 8,758.9 7,944.8 Cash flow data: $ 2,313.3 $ 2,542.8 712.4 $ 2,926.0 613.9 $ 2,629.8 $ 2,541.0 Net cash provided by operating activities Capital expenditures Free cash flow (b) (e) GENERAL MILLS, INC. AND SUBSIDIARIES 729.3 684.4 663.5 1,628.9 1,900.5 1,830.4 1,877.5 2,312.1 Fixed charge coverage ratio () Operating cash flow to debt ratio (b) 7.26 7.40 5.54 8.04 7.62 Fiscal Year 24.4% 31.2% 27.7% 29.0% 36.8% 2016 In Millions 2017 2015 Share data: $ 1,701.1 $ 1,259.4 1,736.8 Net earnings, including earnings attributable to redeemable and noncontrolling interests Other comprehensive income (loss), net of tax: Foreign currency translation Net actuarial income (loss) Low stock price $ $ 55.91 54.12 48.86 46.86 37.55 High stock price Closing stock price 72.64 65.36 57.14 54.40 50.93 (957.9) (358.4) (108.7) (325.9) 6.3 57.32 62.87 56.15 53.81 48.98 197.9 Cash dividends per common share 1.92 1.78 1.67 1.55 1.32 Other fair value changes: Number of full- and part-time employees 38,000 39,000 42,000 43,000 41,000 Securities 0.8 0.1 0.8 Hedge derivatives Reclassification to earnings: Hedge derivatives 53.3 16.0 4.1 (25.7) (9.5) 4.9 Amortization of losses and prior service costs Other comprehensive income (loss), net of tax Total comprehensive income Comprehensive income (loss) attributable to redeemable 122.5 128.6 105.1 (299.4) (1,201.4) 355.1 2,056.2 1,437.4 58.0 (192.9) and noncontrolling interests Comprehensive income attributable to General Mills 31.0 41.5 $ 2,025.2 1,395.9 250.9 See accompanying notes to consolidated financial statements.
CONSOLIDATED BALANCE SHEETS May 28, 2017 May 29, 2016 Net sales by class of similar products were as follows: In Millions Inventories: Fiscal Year GENERAL MILLS, INC. AND SUBSIDIARIES Raw materials and packaging Finished goods In Millions 2017 2016 2015 395.4 397.3 1,224.3 1,163.1 $ 3,302.2 $ 3,297.2 $ 3,392.0 Snacks Grain 73.0 72.6 Cereal 2,673.2 2,731.5 2,771.3 (209.1) 1,483.6 $1,413.7 (219.3) In Millions, Except Par Value May 29, 2016 Excess of FIFO over LIFO cost (a) May 28, 2017 Convenient meals 2,653.6 2,779.0 2,810.3 Total Yogurt Dough Baking mixes and ingredients 1,654.1 Super-premium ice cream 2,403.5 2,760.9 2,938.3 ASSETS (a) Inventories of $893.8 million as of May 28, 2017, and $8410 million as of May 29, 2016, were valued at LIFO. The difference between replacement cost and the stated LIFO inventory value is not materially different from the reserve for the LIFO valuation method. 1,690.6 1,820.0 1,877.0 Current assets: 1,867.7 1,704.3 Cash and cash equivalents $ 763.7 1,360.8 $ 766.1 738.4 731.2 769.5 Receivables 1,430.1 Vegetables 310.5 532.3 937.3 Мay 29, 2016 Inventories 1,483.6 1,413.7 Мay 28, 2017 Other 193.7 206.7 266.9 In Millions $15,619.8 $16,563.1 $17,630.3 Total Prepaid expenses and other current assets 381.6 399.0 Prepaid expenses and other current assets: Total current assets 4,061.4 3,937.2 163.7 Other receivables 159.3 The following table provides financial information by geographic area: Land, buildings, and equipment 3,687.7 3,743.6 Prepaid expenses 168.9 177.9 Goodwill 8,747.2 8,741.2 Derivative receivables, primarily commodity-related Grain contracts Other intangible assets 35.0 44.6 4,530.4 4,538.6 Fiscal Year 2.7 1.8 In Millions 2017 2016 2015 Other assets 785.9 751.7 Miscellaneous 11.3 15.4 Net sales: Total assets $ 21,812.6 $ 21,712.3 381.6 $ Total 399.0 $11,160.9 $11,930.9 $12,501.8 United States 4,632.2 LIABILITIES AND EQUITY Non-United States 4,458.9 5,128.5 May 28, 2017 Мay 29, 2016 $15,619.8 $16,563.1 $17,630.3 Total In Millions Current liabilities: Land, buildings, and equipment Accounts payable $ 2,119.8 2,046.5 Мay 28, 2017 May 29, 2016 $ Land 79.8 92.9 In Millions Current portion of long-term debt Notes payable 604.7 1,103.4 2,236.0 Buildings Buildings under capital lease Equipment Equipment under capital lease Capitalized software Construction in progress Total land, buildings, and equipment Less accumulated depreciation 2,249.2 Cash and cash equivalents: 1,234.1 269.8 0.3 0.3 United States $ 62.9 $ 118.5 Other current liabilities 1,372.2 1,595.0 6,095.9 5,945.6 Non-United States 703.2 645.2 Total current liabilities 5,330.8 5,014.7 3.0 3.0 Total 766.1 763.7 Long-term debt 7,057.7 7,642.9 545.4 523.0 553.0 702.7 Мay 28, 2017 Deferred income taxes 1,719.4 1,399.6 Мay 29, 2016 In Millions 9,526.6 9,503.5 Other liabilities 2,087.6 1,523.1 Land, buildings, and equipment: (5,838.9) (5,759.9) Total liabilities 16,216.2 15,559.6 $ 2,704.0 $ 2,755.1 Total 3,687.7 3,743.6 United States Redeemable interest 910.9 845.6 Non-United States 983.7 988.5 May 28, 2017 May 29, 2016 Stockholders' equity: $ 3,687.7 $ 3,743.6 Total In Millions Common stock, 754.6 shares issued, $0.10 par value Additional paid-in capital 75.5 75.5 Other assets: 1,120.9 1,177.0 Investments in and advances NOTE 17. SUPPLEMENTAL INFORMATION Retained earnings 13,138.9 12,616.5 505.3 $ to joint ventures 518.9 (6,326.6) (2,612.2) Pension assets (7,762.9) 144.9 90.9 Common stock in treasury, at cost, shares of 177.7 and 157.8 The components of certain Consolidated Balance Sheet accounts are as follows: Exchangeable note with related party 12.7 (2,244.5) Accumulated other comprehensive loss Total stockholders' equity Life insurance 25.6 26.3 4,327.9 4,930.2 Miscellaneous 110.1 102.9 Noncontrolling interests Total equity Total liabilities and equity Мay 28, 2017 357.6 376.9 May 29, 2016 Total 785.9 751.7 In Millions 4,685.5 5,307.1 Receivables: $ 21,712.3 $21,812.6 $ 1,454.4 (24.3) $ 1,430.1 $ 1,360.8 $ 1,390.4 Customers (29.6) Less allowance for doubtful accounts See accompanying notes to consolidated financial statements. Total Fiscal Year 2015 (a) In Millions, Except Per Share Data, Percentages and Ratios 2017 2016 2014 2013 CONSOLIDATED STATEMENTS OF EARNINGS Operating data: $ 17,630.3 $ 17,774.1 $15,619.8 $ 16,563.1 17,909.6 Net sales Gross margin b) Selling, general, and administrative expenses Operating profit Total segment operating profit (e Divestitures loss (gain) Net earnings attributable to General Mills Advertising and media expense Research and development expense 5,563.8 5,829.5 5,949.2 6,369.8 6,423.9 3,328.0 2,801.3 3,118.9 3,474.3 3,552.3 GENERAL MILLS, INC. AND SUBSIDIARIES 2,566.4 2,707.4 2,077.3 2,957.4 2,851.8 2,952.6 2,999.5 3,035.0 3,153.9 3,222.9 (148.2) (65.5) 13.5 Fiscal Year 1,657.5 1,697.4 1,221.3 1,824.4 1,855.2 In Millions, Except per Share Data 2017 2016 2015 754.4 623.8 823.1 869.5 895.0 $ 17,630.3 Net sales $ 15,619.8 $ 16,563.1 243.6 218.2 222.1 229.4 237.9 Cost of sales 10,056.0 10,733.6 11,681.1 Average shares outstanding: Selling, general, and administrative expenses Divestitures loss (gain) Restructuring, impairment, and other exit costs Operating profit 3,118.9 3,328.0 2,801.3 Diluted 598.0 611.9 618.8 645.7 665.6 (148.2) 13.5 Earnings per share: 182.6 151.4 543.9 $ $ Diluted 2.77 2.77 1.97 2.83 2.79 2,566.4 2,707.4 2,077.3 Diluted, excluding certain items affecting comparability $ Operating ratios: Gross margin as a percentage of net sales $ 3.08 2.92 $ 2.86 $ 2.82 2.72 $ Interest, net 295.1 303.8 315.4 Earnings before income taxes and after-tax earnings from joint ventures 2,271.3 2,403.6 1,761.9 35.6% 33.7% 35.2% 35.6% 36.1% 655.2 586.8 Income taxes 755.2 Selling, general, and administrative expenses as a After-tax earnings from joint ventures Net earnings, including earnings attributable to redeemable and noncontrolling interests Net earnings attributable to redeemable and noncontrolling interests 85.0 88.4 84.3 percentage of net sales Operating profit as a percentage of net sales Adjusted operating profit 19.4% 17.9% 18.8% 18.9% 20.0% 1,701.1 1,736.8 1,259.4 16.3% 11.8% 16.4% 16.5% 16.0% 43.6 39.4 38.1 $ 1,697.4 $ 1,657.5 Net earnings attribut able to General Mills 1,221.3 as a percentage of net sales (b) (c) Total segment operating profit 18.1% 16.8% 15.9% 16.2% 16.3% Earnings per share basic Earnings per share diluted Dividends per share $ 2.82 2.83 2.02 $ 2.77 2.77 1.97 $ as a percentage of net sales Effective income tax rate 18.9% 18.1% 17.2% 17.6% 18.1% $ 1.92 1.78 1.67 $ $ 28.8% 31.4% 33.3% 33.3% 29.2% See accompanying notes to consolidated financial statements. Return on average total capital 12.7% 12.9% 9.1% 12.5% 13.4% Adjusted return on average total capital b)e) 11.6% 11.3% 11.2% 11.6% 12.0% Balance sheet data: $ 3,687.7 Land, buildings, and equipment Total assets $3,743.6 $ 3,941.9 3,878.1 3,783.3 21,812.6 23,044.7 21,712.3 21,832.0 22,505.7 6,396.6 Long-term debt, excluding current portion 7,642.9 7,057.7 7,575.3 5,901.8 CONSOLIDATED STATEMENTS OF COMPREHENSIVE INCOME Total debt (b) 9,481.7 8,430.9 9,191.5 8,758.9 7,944.8 Cash flow data: $ 2,313.3 $ 2,542.8 712.4 $ 2,926.0 613.9 $ 2,629.8 $ 2,541.0 Net cash provided by operating activities Capital expenditures Free cash flow (b) (e) GENERAL MILLS, INC. AND SUBSIDIARIES 729.3 684.4 663.5 1,628.9 1,900.5 1,830.4 1,877.5 2,312.1 Fixed charge coverage ratio () Operating cash flow to debt ratio (b) 7.26 7.40 5.54 8.04 7.62 Fiscal Year 24.4% 31.2% 27.7% 29.0% 36.8% 2016 In Millions 2017 2015 Share data: $ 1,701.1 $ 1,259.4 1,736.8 Net earnings, including earnings attributable to redeemable and noncontrolling interests Other comprehensive income (loss), net of tax: Foreign currency translation Net actuarial income (loss) Low stock price $ $ 55.91 54.12 48.86 46.86 37.55 High stock price Closing stock price 72.64 65.36 57.14 54.40 50.93 (957.9) (358.4) (108.7) (325.9) 6.3 57.32 62.87 56.15 53.81 48.98 197.9 Cash dividends per common share 1.92 1.78 1.67 1.55 1.32 Other fair value changes: Number of full- and part-time employees 38,000 39,000 42,000 43,000 41,000 Securities 0.8 0.1 0.8 Hedge derivatives Reclassification to earnings: Hedge derivatives 53.3 16.0 4.1 (25.7) (9.5) 4.9 Amortization of losses and prior service costs Other comprehensive income (loss), net of tax Total comprehensive income Comprehensive income (loss) attributable to redeemable 122.5 128.6 105.1 (299.4) (1,201.4) 355.1 2,056.2 1,437.4 58.0 (192.9) and noncontrolling interests Comprehensive income attributable to General Mills 31.0 41.5 $ 2,025.2 1,395.9 250.9 See accompanying notes to consolidated financial statements.

Financial Accounting: The Impact on Decision Makers
10th Edition
ISBN:9781305654174
Author:Gary A. Porter, Curtis L. Norton
Publisher:Gary A. Porter, Curtis L. Norton
Chapter10: Long-term Liabilities
Section: Chapter Questions
Problem 10.9MCP

Related questions
Question
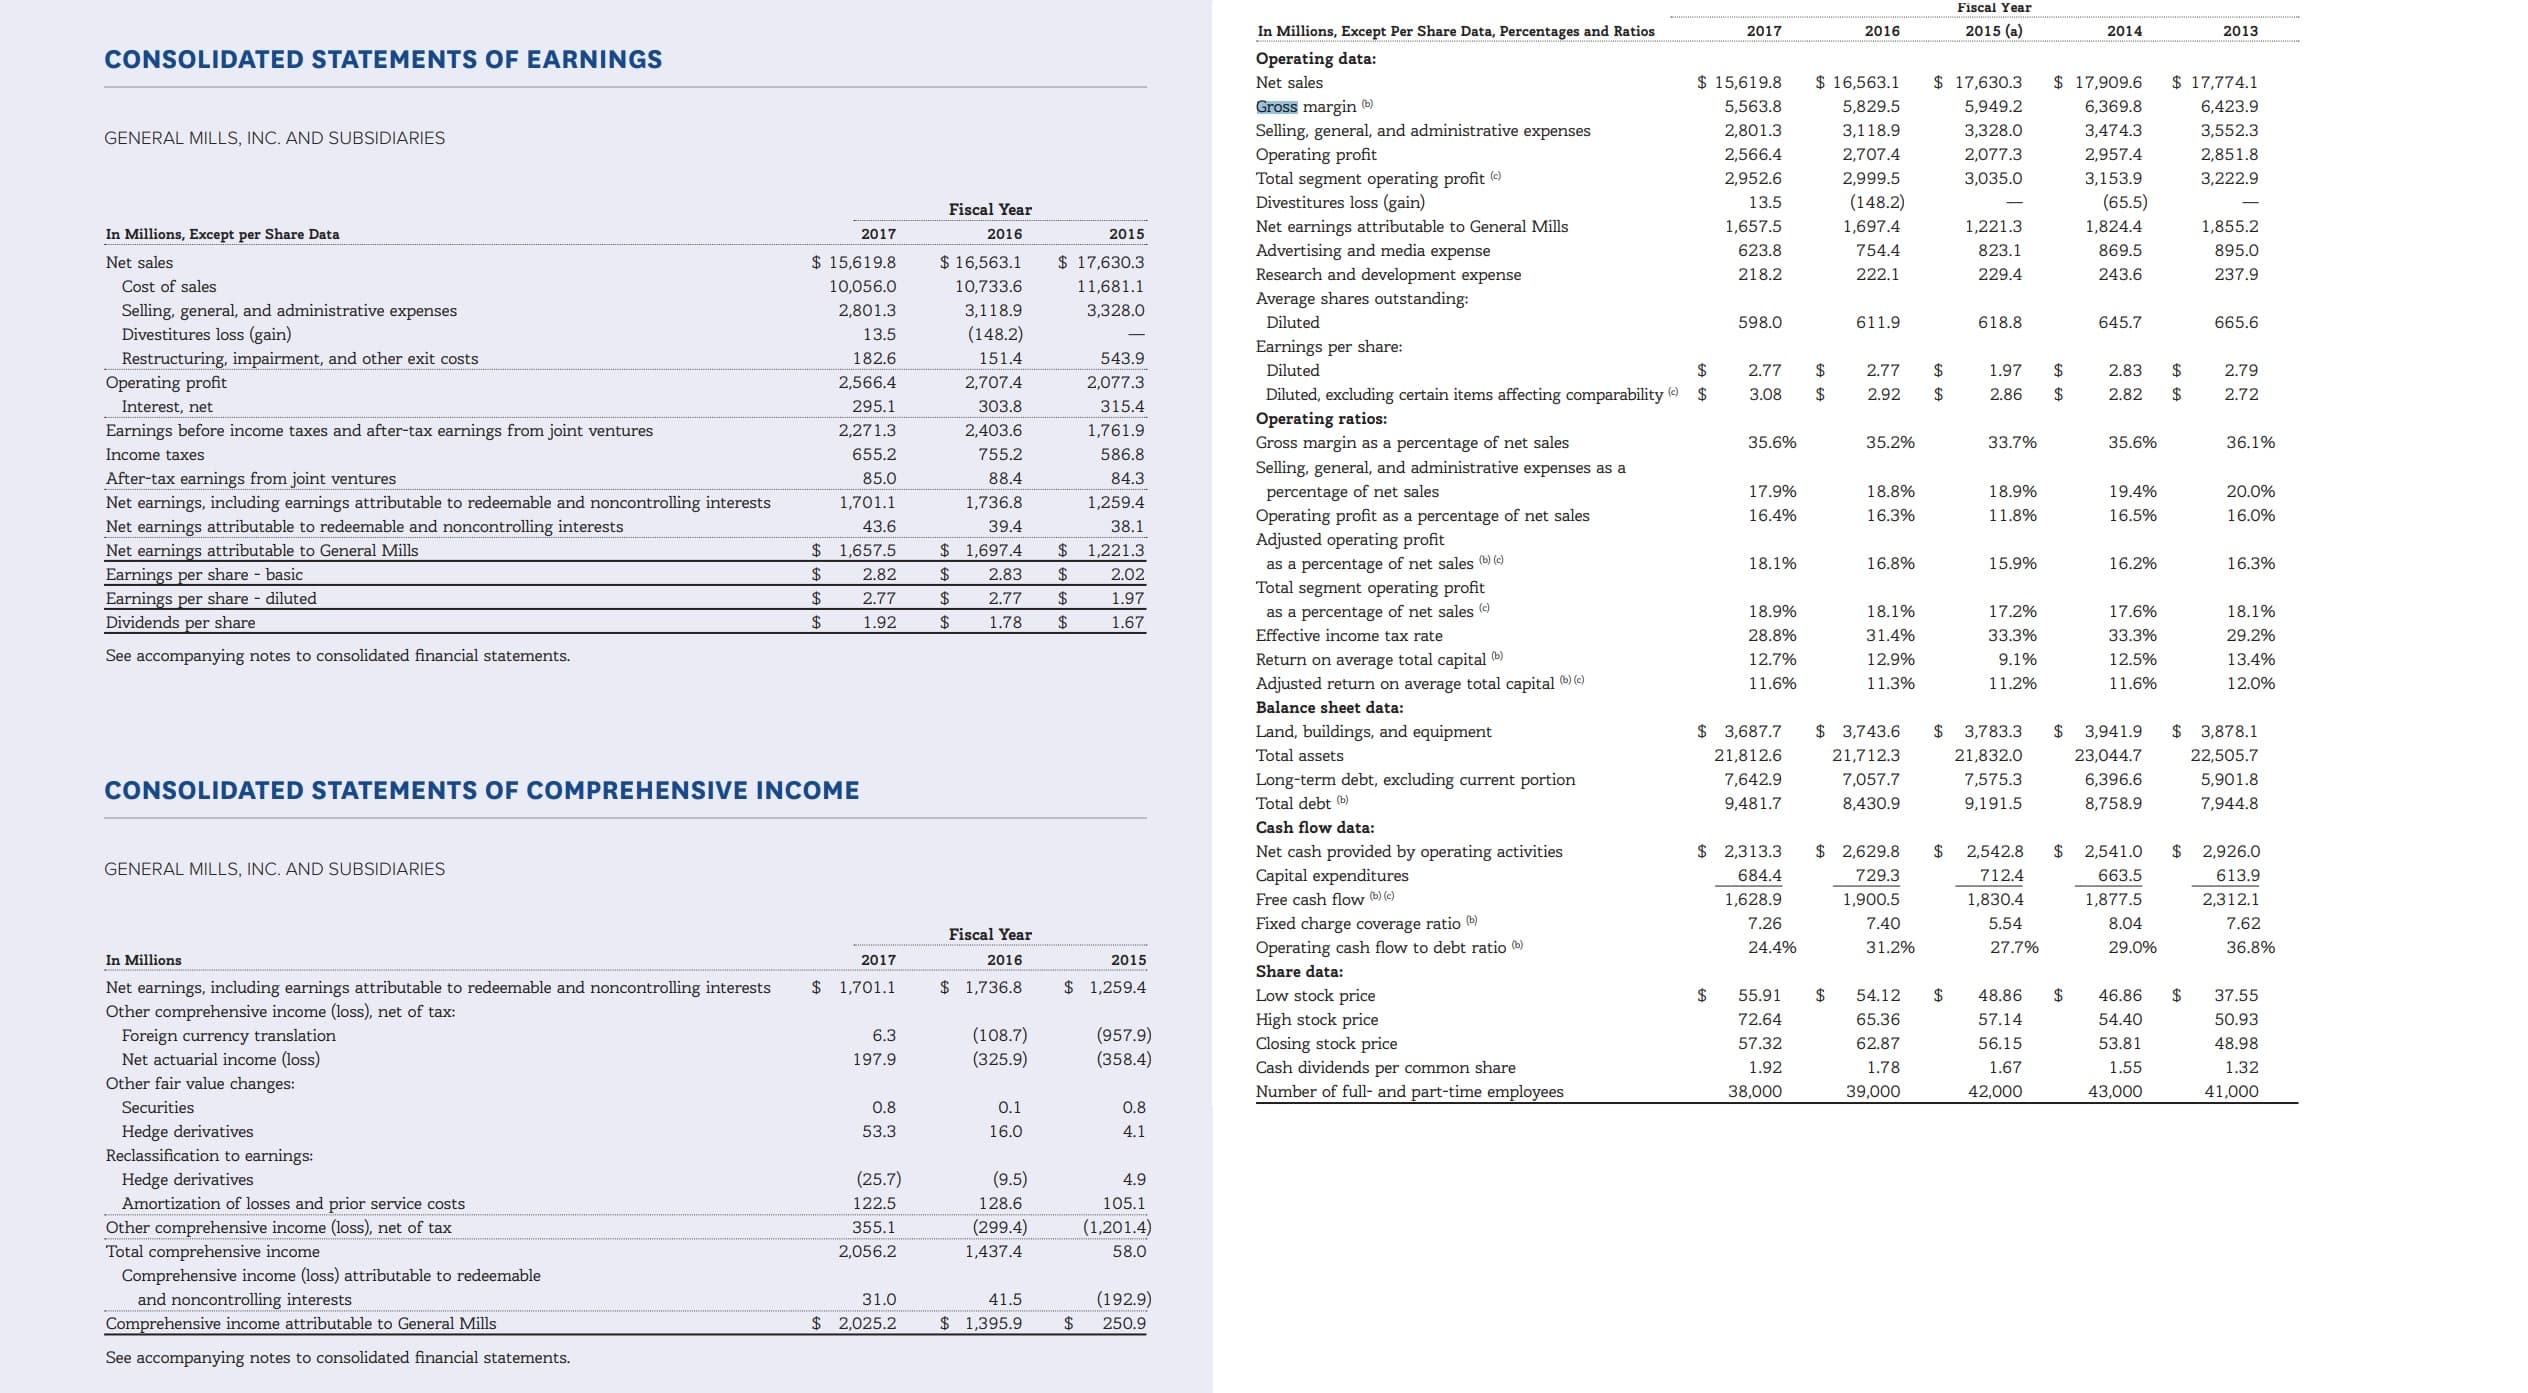
I need assistance in finding the ratios for the following (see attached sheets).
Calculate the following financial ratios for 2016 and 2017
10. Average collection period
11. Inventory turnover ( 2015, inventory = $1,540.9 million)
12. Days' sales in inventory
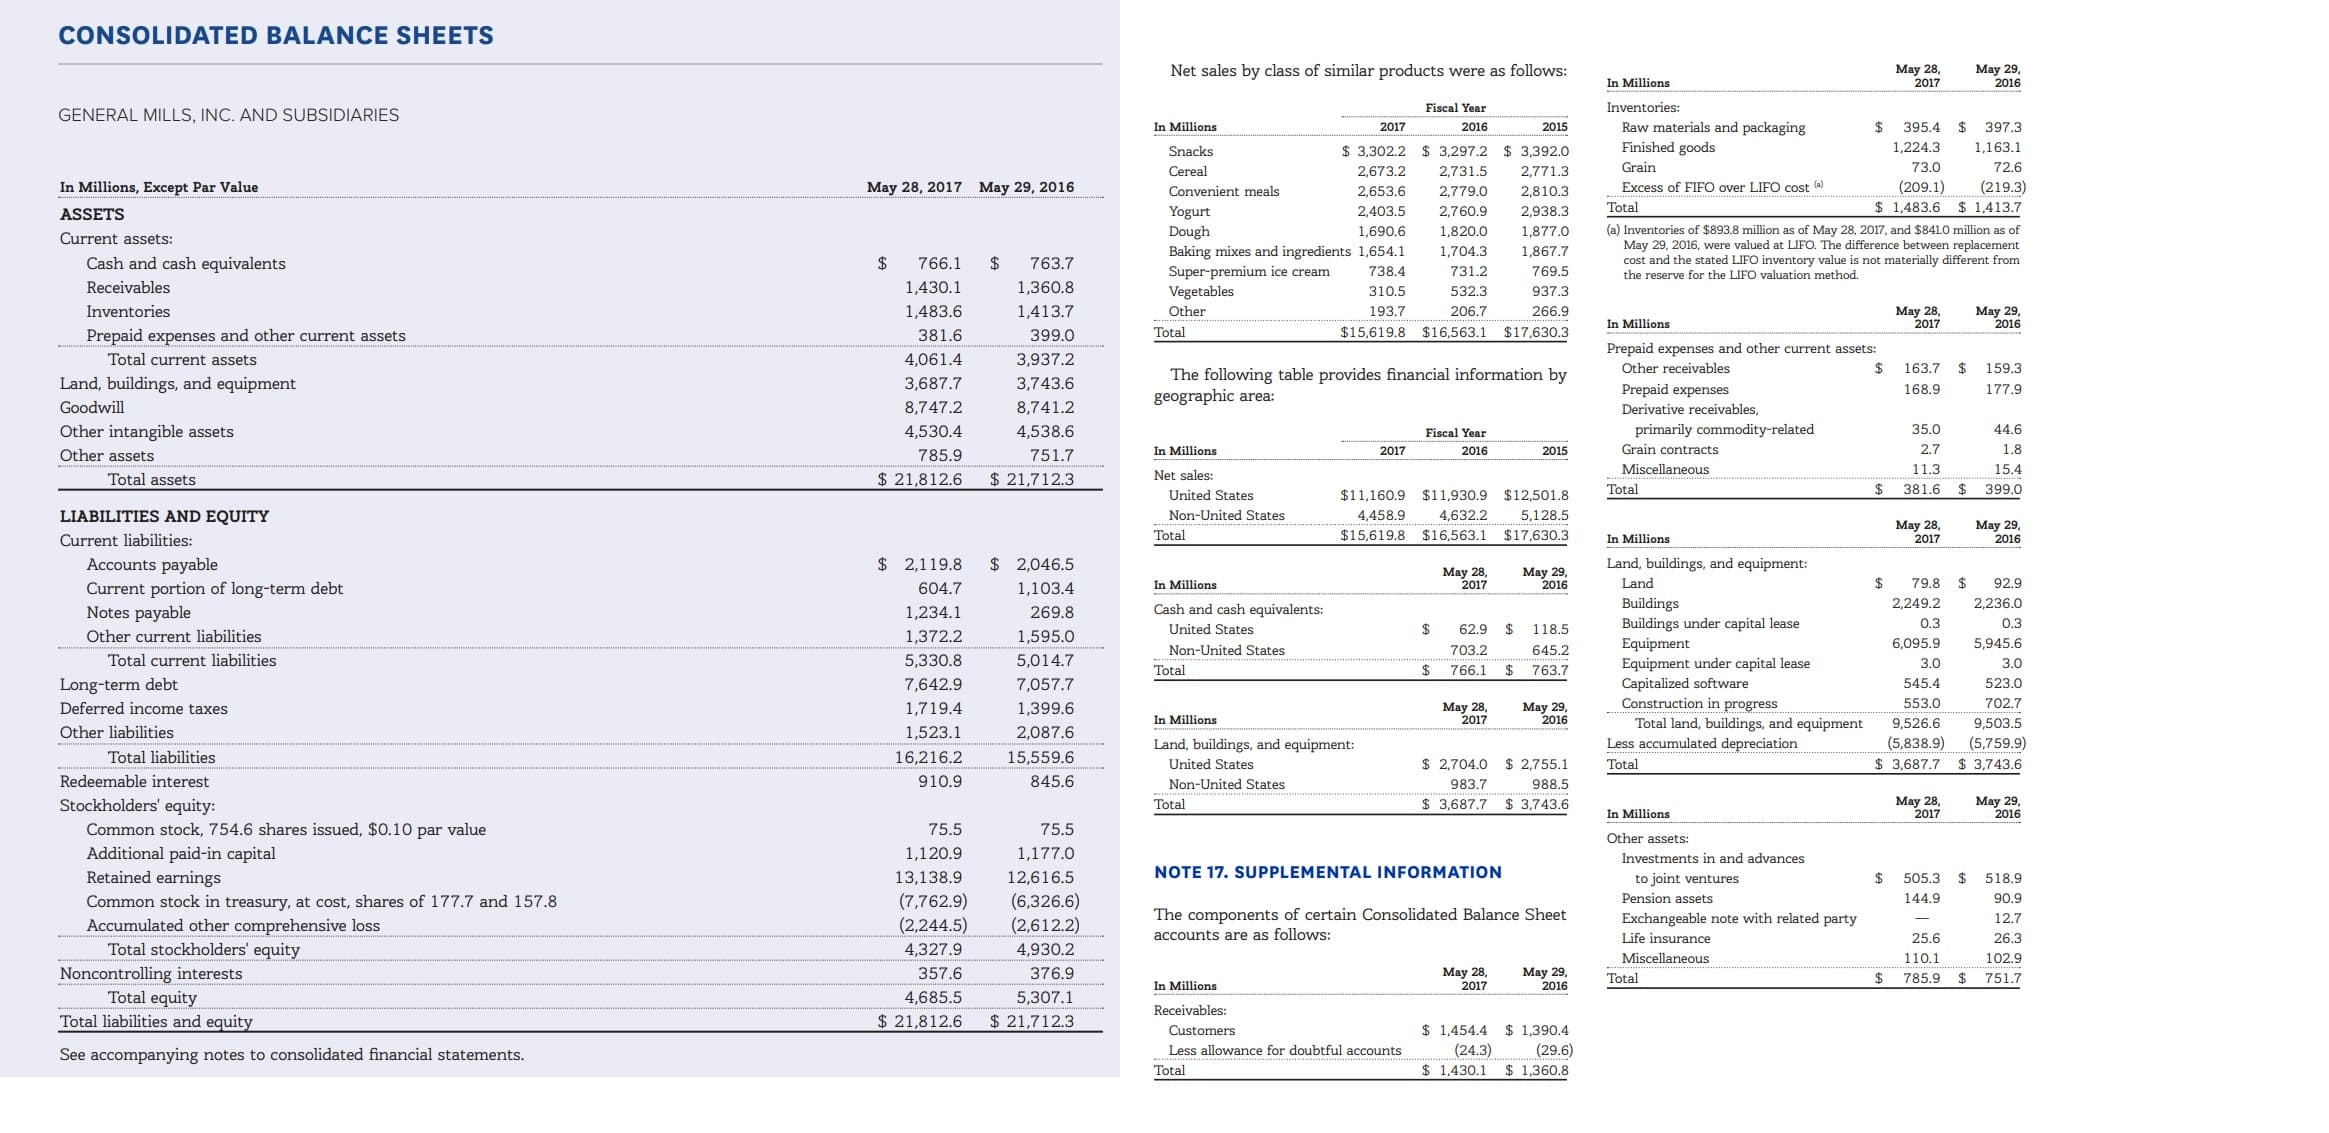
Transcribed Image Text:CONSOLIDATED BALANCE SHEETS
May 28,
2017
May 29,
2016
Net sales by class of similar products were as follows:
In Millions
Inventories:
Fiscal Year
GENERAL MILLS, INC. AND SUBSIDIARIES
Raw materials and packaging
Finished goods
In Millions
2017
2016
2015
395.4
397.3
1,224.3
1,163.1
$ 3,302.2 $ 3,297.2 $ 3,392.0
Snacks
Grain
73.0
72.6
Cereal
2,673.2
2,731.5
2,771.3
(209.1)
1,483.6 $1,413.7
(219.3)
In Millions, Except Par Value
May 29, 2016
Excess of FIFO over LIFO cost (a)
May 28, 2017
Convenient meals
2,653.6
2,779.0
2,810.3
Total
Yogurt
Dough
Baking mixes and ingredients 1,654.1
Super-premium ice cream
2,403.5
2,760.9
2,938.3
ASSETS
(a) Inventories of $893.8 million as of May 28, 2017, and $8410 million as of
May 29, 2016, were valued at LIFO. The difference between replacement
cost and the stated LIFO inventory value is not materially different from
the reserve for the LIFO valuation method.
1,690.6
1,820.0
1,877.0
Current assets:
1,867.7
1,704.3
Cash and cash equivalents
$
763.7
1,360.8
$
766.1
738.4
731.2
769.5
Receivables
1,430.1
Vegetables
310.5
532.3
937.3
Мay 29,
2016
Inventories
1,483.6
1,413.7
Мay 28,
2017
Other
193.7
206.7
266.9
In Millions
$15,619.8
$16,563.1 $17,630.3
Total
Prepaid expenses and other current assets
381.6
399.0
Prepaid expenses and other current assets:
Total current assets
4,061.4
3,937.2
163.7
Other receivables
159.3
The following table provides financial information by
geographic area:
Land, buildings, and equipment
3,687.7
3,743.6
Prepaid expenses
168.9
177.9
Goodwill
8,747.2
8,741.2
Derivative receivables,
primarily commodity-related
Grain contracts
Other intangible assets
35.0
44.6
4,530.4
4,538.6
Fiscal Year
2.7
1.8
In Millions
2017
2016
2015
Other assets
785.9
751.7
Miscellaneous
11.3
15.4
Net sales:
Total assets
$ 21,812.6
$ 21,712.3
381.6 $
Total
399.0
$11,160.9 $11,930.9 $12,501.8
United States
4,632.2
LIABILITIES AND EQUITY
Non-United States
4,458.9
5,128.5
May 28,
2017
Мay 29,
2016
$15,619.8 $16,563.1
$17,630.3
Total
In Millions
Current liabilities:
Land, buildings, and equipment
Accounts payable
$ 2,119.8
2,046.5
Мay 28,
2017
May 29,
2016
$
Land
79.8
92.9
In Millions
Current portion of long-term debt
Notes payable
604.7
1,103.4
2,236.0
Buildings
Buildings under capital lease
Equipment
Equipment under capital lease
Capitalized software
Construction in progress
Total land, buildings, and equipment
Less accumulated depreciation
2,249.2
Cash and cash equivalents:
1,234.1
269.8
0.3
0.3
United States
$
62.9
$
118.5
Other current liabilities
1,372.2
1,595.0
6,095.9
5,945.6
Non-United States
703.2
645.2
Total current liabilities
5,330.8
5,014.7
3.0
3.0
Total
766.1
763.7
Long-term debt
7,057.7
7,642.9
545.4
523.0
553.0
702.7
Мay 28,
2017
Deferred income taxes
1,719.4
1,399.6
Мay 29,
2016
In Millions
9,526.6
9,503.5
Other liabilities
2,087.6
1,523.1
Land, buildings, and equipment:
(5,838.9)
(5,759.9)
Total liabilities
16,216.2
15,559.6
$ 2,704.0
$ 2,755.1
Total
3,687.7
3,743.6
United States
Redeemable interest
910.9
845.6
Non-United States
983.7
988.5
May 28,
2017
May 29,
2016
Stockholders' equity:
$ 3,687.7
$ 3,743.6
Total
In Millions
Common stock, 754.6 shares issued, $0.10 par value
Additional paid-in capital
75.5
75.5
Other assets:
1,120.9
1,177.0
Investments in and advances
NOTE 17. SUPPLEMENTAL INFORMATION
Retained earnings
13,138.9
12,616.5
505.3 $
to joint ventures
518.9
(6,326.6)
(2,612.2)
Pension assets
(7,762.9)
144.9
90.9
Common stock in treasury, at cost, shares of 177.7 and 157.8
The components of certain Consolidated Balance Sheet
accounts are as follows:
Exchangeable note with related party
12.7
(2,244.5)
Accumulated other comprehensive loss
Total stockholders' equity
Life insurance
25.6
26.3
4,327.9
4,930.2
Miscellaneous
110.1
102.9
Noncontrolling interests
Total equity
Total liabilities and equity
Мay 28,
2017
357.6
376.9
May 29,
2016
Total
785.9
751.7
In Millions
4,685.5
5,307.1
Receivables:
$ 21,712.3
$21,812.6
$ 1,454.4
(24.3)
$ 1,430.1 $ 1,360.8
$ 1,390.4
Customers
(29.6)
Less allowance for doubtful accounts
See accompanying notes to consolidated financial statements.
Total
Transcribed Image Text:Fiscal Year
2015 (a)
In Millions, Except Per Share Data, Percentages and Ratios
2017
2016
2014
2013
CONSOLIDATED STATEMENTS OF EARNINGS
Operating data:
$ 17,630.3
$ 17,774.1
$15,619.8
$ 16,563.1
17,909.6
Net sales
Gross margin b)
Selling, general, and administrative expenses
Operating profit
Total segment operating profit (e
Divestitures loss (gain)
Net earnings attributable to General Mills
Advertising and media expense
Research and development expense
5,563.8
5,829.5
5,949.2
6,369.8
6,423.9
3,328.0
2,801.3
3,118.9
3,474.3
3,552.3
GENERAL MILLS, INC. AND SUBSIDIARIES
2,566.4
2,707.4
2,077.3
2,957.4
2,851.8
2,952.6
2,999.5
3,035.0
3,153.9
3,222.9
(148.2)
(65.5)
13.5
Fiscal Year
1,657.5
1,697.4
1,221.3
1,824.4
1,855.2
In Millions, Except per Share Data
2017
2016
2015
754.4
623.8
823.1
869.5
895.0
$ 17,630.3
Net sales
$ 15,619.8
$ 16,563.1
243.6
218.2
222.1
229.4
237.9
Cost of sales
10,056.0
10,733.6
11,681.1
Average shares outstanding:
Selling, general, and administrative expenses
Divestitures loss (gain)
Restructuring, impairment, and other exit costs
Operating profit
3,118.9
3,328.0
2,801.3
Diluted
598.0
611.9
618.8
645.7
665.6
(148.2)
13.5
Earnings per share:
182.6
151.4
543.9
$
$
Diluted
2.77
2.77
1.97
2.83
2.79
2,566.4
2,707.4
2,077.3
Diluted, excluding certain items affecting comparability $
Operating ratios:
Gross margin as a percentage of net sales
$
3.08
2.92
$
2.86
$
2.82
2.72
$
Interest, net
295.1
303.8
315.4
Earnings before income taxes and after-tax earnings from joint ventures
2,271.3
2,403.6
1,761.9
35.6%
33.7%
35.2%
35.6%
36.1%
655.2
586.8
Income taxes
755.2
Selling, general, and administrative expenses as a
After-tax earnings from joint ventures
Net earnings, including earnings attributable to redeemable and noncontrolling interests
Net earnings attributable to redeemable and noncontrolling interests
85.0
88.4
84.3
percentage of net sales
Operating profit as a percentage of net sales
Adjusted operating profit
19.4%
17.9%
18.8%
18.9%
20.0%
1,701.1
1,736.8
1,259.4
16.3%
11.8%
16.4%
16.5%
16.0%
43.6
39.4
38.1
$ 1,697.4
$ 1,657.5
Net earnings attribut able to General Mills
1,221.3
as a percentage of net sales (b) (c)
Total segment operating profit
18.1%
16.8%
15.9%
16.2%
16.3%
Earnings per share basic
Earnings per share diluted
Dividends per share
$
2.82
2.83
2.02
$
2.77
2.77
1.97
$
as a percentage of net sales
Effective income tax rate
18.9%
18.1%
17.2%
17.6%
18.1%
$
1.92
1.78
1.67
$
$
28.8%
31.4%
33.3%
33.3%
29.2%
See accompanying notes to consolidated financial statements.
Return on average total capital
12.7%
12.9%
9.1%
12.5%
13.4%
Adjusted return on average total capital b)e)
11.6%
11.3%
11.2%
11.6%
12.0%
Balance sheet data:
$ 3,687.7
Land, buildings, and equipment
Total assets
$3,743.6
$
3,941.9
3,878.1
3,783.3
21,812.6
23,044.7
21,712.3
21,832.0
22,505.7
6,396.6
Long-term debt, excluding current portion
7,642.9
7,057.7
7,575.3
5,901.8
CONSOLIDATED STATEMENTS OF COMPREHENSIVE INCOME
Total debt (b)
9,481.7
8,430.9
9,191.5
8,758.9
7,944.8
Cash flow data:
$ 2,313.3
$
2,542.8
712.4
$
2,926.0
613.9
$ 2,629.8
$ 2,541.0
Net cash provided by operating activities
Capital expenditures
Free cash flow (b) (e)
GENERAL MILLS, INC. AND SUBSIDIARIES
729.3
684.4
663.5
1,628.9
1,900.5
1,830.4
1,877.5
2,312.1
Fixed charge coverage ratio ()
Operating cash flow to debt ratio (b)
7.26
7.40
5.54
8.04
7.62
Fiscal Year
24.4%
31.2%
27.7%
29.0%
36.8%
2016
In Millions
2017
2015
Share data:
$ 1,701.1
$ 1,259.4
1,736.8
Net earnings, including earnings attributable to redeemable and noncontrolling interests
Other comprehensive income (loss), net of tax:
Foreign currency translation
Net actuarial income (loss)
Low stock price
$
$
55.91
54.12
48.86
46.86
37.55
High stock price
Closing stock price
72.64
65.36
57.14
54.40
50.93
(957.9)
(358.4)
(108.7)
(325.9)
6.3
57.32
62.87
56.15
53.81
48.98
197.9
Cash dividends per common share
1.92
1.78
1.67
1.55
1.32
Other fair value changes:
Number of full- and part-time employees
38,000
39,000
42,000
43,000
41,000
Securities
0.8
0.1
0.8
Hedge derivatives
Reclassification to earnings:
Hedge derivatives
53.3
16.0
4.1
(25.7)
(9.5)
4.9
Amortization of losses and prior service costs
Other comprehensive income (loss), net of tax
Total comprehensive income
Comprehensive income (loss) attributable to redeemable
122.5
128.6
105.1
(299.4)
(1,201.4)
355.1
2,056.2
1,437.4
58.0
(192.9)
and noncontrolling interests
Comprehensive income attributable to General Mills
31.0
41.5
$ 2,025.2
1,395.9
250.9
See accompanying notes to consolidated financial statements.
Expert Solution
This question has been solved!
Explore an expertly crafted, step-by-step solution for a thorough understanding of key concepts.

This is a popular solution!

Trending now
This is a popular solution!

Step by step
Solved in 2 steps with 1 images

Knowledge Booster


Learn more about
Need a deep-dive on the concept behind this application? Look no further. Learn more about this topic, accounting and related others by exploring similar questions and additional content below.Recommended textbooks for you
Financial Accounting: The Impact on Decision Make…
Accounting
ISBN:
9781305654174
Author:
Gary A. Porter, Curtis L. Norton
Publisher:
Cengage Learning

Managerial Accounting
Accounting
ISBN:
9781337912020
Author:
Carl Warren, Ph.d. Cma William B. Tayler
Publisher:
South-Western College Pub

Cornerstones of Financial Accounting
Accounting
ISBN:
9781337690881
Author:
Jay Rich, Jeff Jones
Publisher:
Cengage Learning
Financial Accounting: The Impact on Decision Make…
Accounting
ISBN:
9781305654174
Author:
Gary A. Porter, Curtis L. Norton
Publisher:
Cengage Learning
Managerial Accounting
Accounting
ISBN:
9781337912020
Author:
Carl Warren, Ph.d. Cma William B. Tayler
Publisher:
South-Western College Pub
Cornerstones of Financial Accounting
Accounting
ISBN:
9781337690881
Author:
Jay Rich, Jeff Jones
Publisher:
Cengage Learning

Financial & Managerial Accounting
Accounting
ISBN:
9781285866307
Author:
Carl Warren, James M. Reeve, Jonathan Duchac
Publisher:
Cengage Learning