Construct a frequency distribution for the given data set using 6 classes. In the table, include the midpoints, relative frequencies, and cumulative frequencies. Which class has the greatest frequency and which has the least frequency? Amount (in dollars) spent on books for a semester 166 345 151 424 406 353D 94 407 95 125 516 525 336 199 256 317 286 473 156 126 59 501 144 42 443 218 40 488 427 Complete the table, starting with the lowest class limit. Use the minimum data entry as the lower limit of the first class. (Type integers or decimals. Round the class limits to the nearest whole number. Round all other values to the nearest thousandth as needed.) Cumulative Relative Frequency Frequency Midpoint Frequency Class
Construct a frequency distribution for the given data set using 6 classes. In the table, include the midpoints, relative frequencies, and cumulative frequencies. Which class has the greatest frequency and which has the least frequency? Amount (in dollars) spent on books for a semester 166 345 151 424 406 353D 94 407 95 125 516 525 336 199 256 317 286 473 156 126 59 501 144 42 443 218 40 488 427 Complete the table, starting with the lowest class limit. Use the minimum data entry as the lower limit of the first class. (Type integers or decimals. Round the class limits to the nearest whole number. Round all other values to the nearest thousandth as needed.) Cumulative Relative Frequency Frequency Midpoint Frequency Class

MATLAB: An Introduction with Applications
6th Edition
ISBN:9781119256830
Author:Amos Gilat
Publisher:Amos Gilat
Chapter1: Starting With Matlab
Section: Chapter Questions
Problem 1P

Related questions
Question
100%
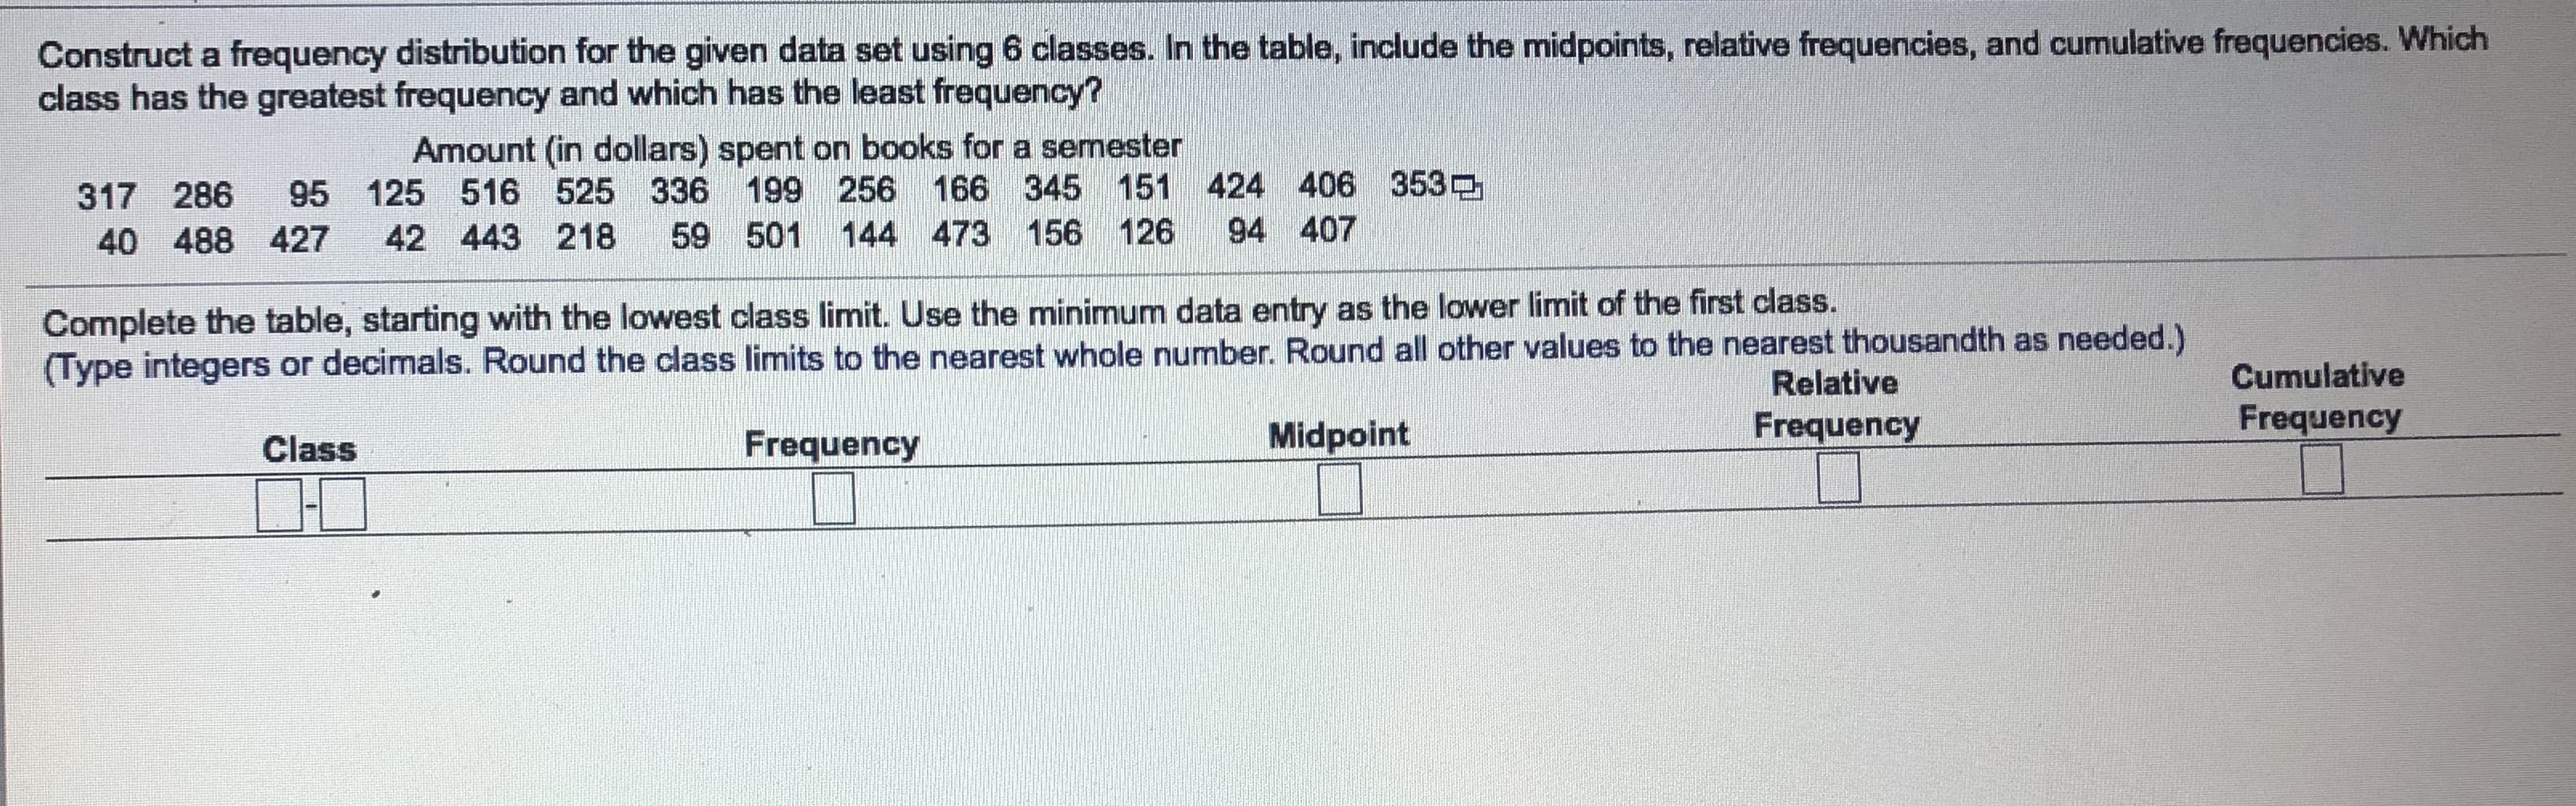
Transcribed Image Text:Construct a frequency distribution for the given data set using 6 classes. In the table, include the midpoints, relative frequencies, and cumulative frequencies. Which
class has the greatest frequency and which has the least frequency?
Amount (in dollars) spent on books for a semester
166 345 151 424 406 353D
94 407
95 125 516 525 336 199 256
317 286
473 156 126
59 501
144
42 443 218
40 488 427
Complete the table, starting with the lowest class limit. Use the minimum data entry as the lower limit of the first class.
(Type integers or decimals. Round the class limits to the nearest whole number. Round all other values to the nearest thousandth as needed.)
Cumulative
Relative
Frequency
Frequency
Midpoint
Frequency
Class
Expert Solution
This question has been solved!
Explore an expertly crafted, step-by-step solution for a thorough understanding of key concepts.

This is a popular solution!

Trending now
This is a popular solution!

Step by step
Solved in 3 steps with 2 images

Recommended textbooks for you
MATLAB: An Introduction with Applications
Statistics
ISBN:
9781119256830
Author:
Amos Gilat
Publisher:
John Wiley & Sons Inc

Probability and Statistics for Engineering and th…
Statistics
ISBN:
9781305251809
Author:
Jay L. Devore
Publisher:
Cengage Learning

Statistics for The Behavioral Sciences (MindTap C…
Statistics
ISBN:
9781305504912
Author:
Frederick J Gravetter, Larry B. Wallnau
Publisher:
Cengage Learning
MATLAB: An Introduction with Applications
Statistics
ISBN:
9781119256830
Author:
Amos Gilat
Publisher:
John Wiley & Sons Inc
Probability and Statistics for Engineering and th…
Statistics
ISBN:
9781305251809
Author:
Jay L. Devore
Publisher:
Cengage Learning
Statistics for The Behavioral Sciences (MindTap C…
Statistics
ISBN:
9781305504912
Author:
Frederick J Gravetter, Larry B. Wallnau
Publisher:
Cengage Learning

Elementary Statistics: Picturing the World (7th E…
Statistics
ISBN:
9780134683416
Author:
Ron Larson, Betsy Farber
Publisher:
PEARSON

The Basic Practice of Statistics
Statistics
ISBN:
9781319042578
Author:
David S. Moore, William I. Notz, Michael A. Fligner
Publisher:
W. H. Freeman

Introduction to the Practice of Statistics
Statistics
ISBN:
9781319013387
Author:
David S. Moore, George P. McCabe, Bruce A. Craig
Publisher:
W. H. Freeman