Consumer Preferences. In 2018, consumer goods giant Procter and Gamble (P&G) had more than 20 brands with more than $1 billion in annual sales (P&G website). How does a company like P&G create so many successful consumer products? P&G effectively invests in research and development to understand what consumers want. One method used to determine consumer preferences is called conjoint analysis. Conjoint analysis allows a company to ascertain the utility that a respondent in the conjoint study places on a design of a given product. The higher the utility, the more valuable a respondent finds the design. Suppose we have conducted a conjoint study and have the following estimated utilities (higher is preferred) for each of three different designs for a new whitening toothpaste. At the .05 level of significance, test for any significant differences.a. Use the Excel data analysis tool to perform the required test.b. What are the null and alternative hypothesis?c. What is the test statistic? What distribution does the test statistic follow?d. State your conclusions.
Consumer Preferences. In 2018, consumer goods giant Procter and Gamble (P&G) had more than 20 brands with more than $1 billion in annual sales (P&G website). How does a company like P&G create so many successful consumer products? P&G effectively invests in research and development to understand what consumers want. One method used to determine consumer preferences is called conjoint analysis. Conjoint analysis allows a company to ascertain the utility that a respondent in the conjoint study places on a design of a given product. The higher the utility, the more valuable a respondent finds the design. Suppose we have conducted a conjoint study and have the following estimated utilities (higher is preferred) for each of three different designs for a new whitening toothpaste. At the .05 level of significance, test for any significant differences.a. Use the Excel data analysis tool to perform the required test.b. What are the null and alternative hypothesis?c. What is the test statistic? What distribution does the test statistic follow?d. State your conclusions.

MATLAB: An Introduction with Applications
6th Edition
ISBN:9781119256830
Author:Amos Gilat
Publisher:Amos Gilat
Chapter1: Starting With Matlab
Section: Chapter Questions
Problem 1P

Related questions
Question
Consumer Preferences. In 2018, consumer goods giant Procter and Gamble (P&G) had more than 20 brands with more than $1 billion in annual sales (P&G website). How does a company like P&G create so many successful consumer products? P&G effectively invests in research and development to understand what consumers want. One method used to determine consumer preferences is called conjoint analysis. Conjoint analysis allows a company to ascertain the utility that a respondent in the conjoint study places on a design of a given product. The higher the utility, the more valuable a respondent finds the design. Suppose we have conducted a conjoint study and have the following estimated utilities (higher is preferred) for each of three different designs for a new whitening toothpaste. At the .05 level of significance, test for any significant differences.a. Use the Excel data analysis tool to perform the required test.b. What are the null and alternative hypothesis?c. What is the test statistic? What distribution does the test statistic follow?d. State your conclusions.
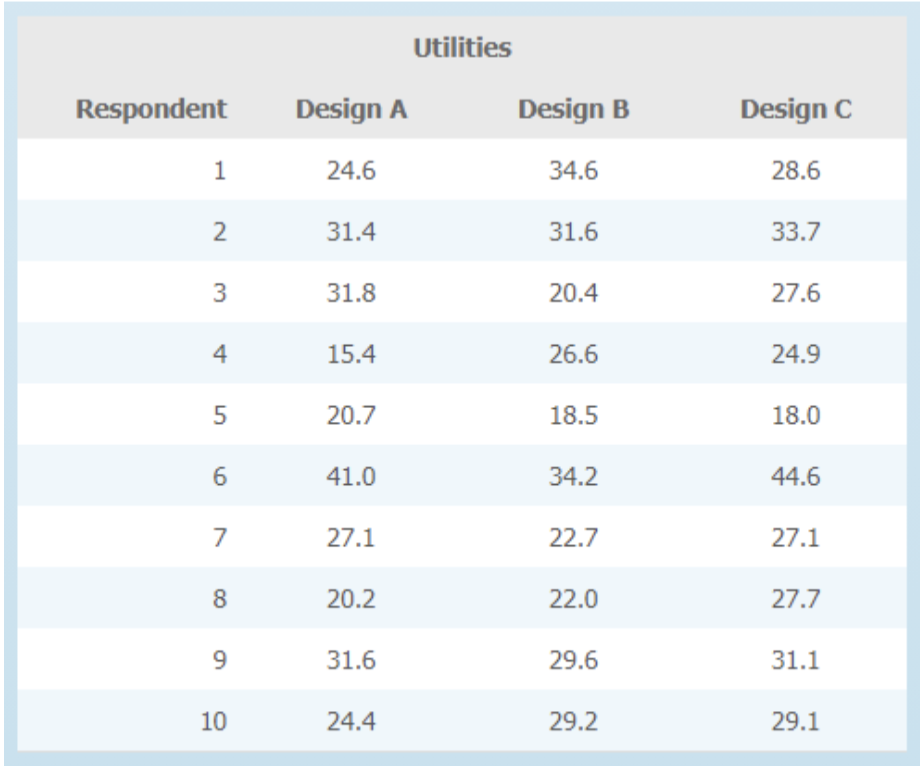
Transcribed Image Text:Utilities
Respondent
Design A
Design B
Design C
1
24.6
34.6
28.6
31.4
31.6
33.7
31.8
20.4
27.6
15.4
26.6
24.9
20.7
18.5
18.0
41.0
34.2
44.6
7
27.1
22.7
27.1
20.2
22.0
27.7
9
31.6
29.6
31.1
10
24.4
29.2
29.1
3.
4.
5.
6.
Expert Solution
This question has been solved!
Explore an expertly crafted, step-by-step solution for a thorough understanding of key concepts.

This is a popular solution!

Trending now
This is a popular solution!

Step by step
Solved in 2 steps with 1 images

Knowledge Booster


Learn more about
Need a deep-dive on the concept behind this application? Look no further. Learn more about this topic, statistics and related others by exploring similar questions and additional content below.Recommended textbooks for you
MATLAB: An Introduction with Applications
Statistics
ISBN:
9781119256830
Author:
Amos Gilat
Publisher:
John Wiley & Sons Inc

Probability and Statistics for Engineering and th…
Statistics
ISBN:
9781305251809
Author:
Jay L. Devore
Publisher:
Cengage Learning

Statistics for The Behavioral Sciences (MindTap C…
Statistics
ISBN:
9781305504912
Author:
Frederick J Gravetter, Larry B. Wallnau
Publisher:
Cengage Learning
MATLAB: An Introduction with Applications
Statistics
ISBN:
9781119256830
Author:
Amos Gilat
Publisher:
John Wiley & Sons Inc
Probability and Statistics for Engineering and th…
Statistics
ISBN:
9781305251809
Author:
Jay L. Devore
Publisher:
Cengage Learning
Statistics for The Behavioral Sciences (MindTap C…
Statistics
ISBN:
9781305504912
Author:
Frederick J Gravetter, Larry B. Wallnau
Publisher:
Cengage Learning

Elementary Statistics: Picturing the World (7th E…
Statistics
ISBN:
9780134683416
Author:
Ron Larson, Betsy Farber
Publisher:
PEARSON

The Basic Practice of Statistics
Statistics
ISBN:
9781319042578
Author:
David S. Moore, William I. Notz, Michael A. Fligner
Publisher:
W. H. Freeman

Introduction to the Practice of Statistics
Statistics
ISBN:
9781319013387
Author:
David S. Moore, George P. McCabe, Bruce A. Craig
Publisher:
W. H. Freeman