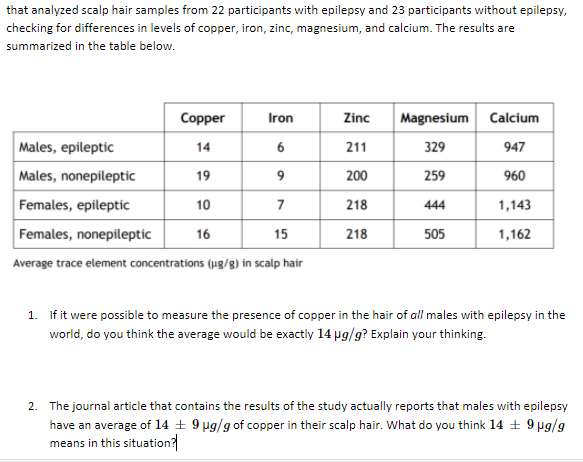
Copper Iron Zinc Magnesium Calcium Males, epileptic 14 6 211 329 947 Males, nonepileptic 200 960 19 259 Females, epileptic 10 7 218 444 1,143 Females, nonepileptic 16 15 218 505 1,162 Average trace element concentrations (ug/g) in scalp hair 1. If it were possible to measure the presence of copper in the hair of all males with epilepsy in the world, do you think the average would be exactly 14 pg/g? Explain your thinking.


Q: 46. A population of N = 20 scores has EX = 50 and EX 2=4200. For this population, what is the value…
A: using the given data Find SS = ?
Q: The mean ±1 sd of ln [calcium intake (mg)] among 25 females, 12 to 14 years of age, below the…
A: The given data set is:
Q: ) What type of t-test should be used to compare the two methods and why? b) Do the two methods give…
A: Given Sample Method A Method B 1 0.39 0.36 2 0.84 1.35 3 1.76 2.56 4 3.35 3.92 5 4.69…
Q: Example 9: Obtain the M.L.E.s of a and B for the random sample from the exponential population f (x…
A:
Q: Penicillin is produced by the Penicillin fungus, which is grown in a broth whose sugar content must…
A: The ANOVA is conducted by using EXCEL. The software procedure is given below: Enter the data.…
Q: 3) A undergraduate researcher wanted to know whether enzyme activity of mannose-6-phosphate…
A: ANOVA: The analysis of variance (ANOVA) is used to determine whether there are any statistically…
Q: greater than 30 parts per billion. To test this estimate, you determine the 29 17 44 23 22 35 23 17…
A: For the given Sample : The Standard Deviation, s : 9.195 Null and Alternative Hypotheses The…
Q: i ca after participating in an aerobic exercise program and swi wn in the following table: Blood…
A: *Answer: Open a.Reject the Null Hypothesis. 5.465 > 1.761is the correct answer. * Explanation:
Q: 6. Suppose that X is an Exponential with rate 1 and that, given X = x, Y is an Exponential with rate…
A:
Q: Which of the following is correct? I. In a retrospective study, the researcher observes the process…
A: Observational study: If the researcher observes the behavior of the units in the study and provides…
Q: Lichen has a high absorbance capacity for radiation fallout from nuclear accidents. Since lichen is…
A: Since, you have you have posted a question with multiple subparts we will solve first three subparts…
Q: his is your experimental data for Experiment #7, Determination of Glucose Using a Biosensor. YOU…
A: Given Information: Standard 1 has a meter reading of 84 mg/dL Standard 2 has a meter reading of 127…
Q: 2. Researchers looking at age and lifetime assault victimization interviewed nine adults and found…
A: a. The independent variable is X1X1, and the dependent variable is X2X2. In order to compute the…
Q: utrition The mean ±1 sd of In [calcium intake (mg)] among 25 females, 12 to 14 years of age, below…
A: Note: Hey, since there are multiple questions posted, we will answer first question. If you want any…
Q: Two different analytical methods were used to determine residual chlorine in sewage effluents. Both…
A: INTROUDUCTION : PAIRED T TEST FOR DIFFERENCE OF MEANS : when the sample sizes are equal of both…
Q: QUESTION 10 Find the critical value or values of y2 based on the given information. H1: o > 26.1 n =…
A: The provided information is: Sample size (n) = 0.01 Test is right tailed Level of significance is…
Q: Two samples, one each from two batches of a product, were analyzed for trace iron content by the…
A: Given, α = 0.05 Two batches of product having specific iron content as given in table Batch A…
Q: Four laboratories are being used to perform chemical analyses. Samples of the same are sent to the…
A: We have to conduct One way Anova Using Excel , Data -----> Data Analysis -----> Anova :…
Q: Carbon Monoxide Tar (mg) weight (g) 13.6 14.1 0.9853 16.6 16 1.0938 23.5 29.8 1.165 10.2 8 0.928 5.4…
A: Given Information:
Q: 9. Fill in the blanks of the following skeleton life table which are marked with question marks :…
A:
Q: 376 an38. From the following data calculate Karl Pearson's coefficient of skewness: 80 Maks more…
A:
Q: Of the following, which one is an observational study? measuring the average strength of a batch of…
A: A) measuring the average strength of a batch of metal by stressing some sample pieces until they…
Q: Describe the histogram shape as well ? Symmetric , skewed left or skewed right
A:
Q: In a certain suburb of Montréal, residents have expressed their worries about the quality of the…
A: Part A: Given that, the environmental standard is a PM2.5 concentration of 15 μg/m3 or less. n=25,…
Q: EXERCISE NO. 1 The concentration of suspended solids in river water is important an environmental…
A: Calculate Mean, Median, Mode from the following…
Q: The following table gives the distribution of gas bills (GB’s) of some households (hhs) in a city-…
A: Given data :
Q: The mean ±1 sd of ln [calcium intake (mg)] among 25 females, 12 to 14 years of age, below the…
A:
Q: 7.12 Auto exhaust and lead exposure. Researchers interested in lead exposure due to car exhaust…
A: The given information is:
Q: 2.890 A consumer buying cooperative tested the effective heating area of 20 different electric space…
A: The independent variable is Wattage. The dependent variable is Area. We have to do correlation and…
Q: QUESTION 10 What is the minimum Chi Square calculated value necessary to reach the .01 alpha level…
A: Given : df = 6
Q: Two groups of experimental rats were injected with tranquilizer at 1.0mg dose and at 1.5 mg dose,…
A: Given :
Q: It might be predicted that consumer buying behavior would vary with the location of products in a…
A: Excel is used to analyse the data and made the decision about the null hypothesis. The steps are as:…
Q: Researchers decide to ask all of the students and staff at the school about the usual quantity of…
A: ( 14) Attack rate = (Number Ill /Total) ×100 For 0 glasses Attack rate = (4/13)×100 = 0.308×100…
Q: It is claimed that the current input to a television tube needed to achieve a specified brightness…
A: The hypothesized mean is 800.
Q: The following is an experiment I have designed to analyze the effects of battery type and ambient…
A: Treatments: In an experimental study the subjects are imposed certain experimental conditions, these…
Q: In an experiment to determine the effect of ambient temperature on the emissons of oxides of…
A:
Q: onstruct an ANOVA table. Round your answers to four decimal places as needed. One-way ANOVA: Sugar…
A: The ANOVA is conducted by using EXCEL. The software procedure is given below: Enter the data.…
Q: 8 5 1009 9 003 2 1 7 00004 2 0 0 0 00 0 0000 0 0 A = lar values does A have?
A: Follow the steps.
Q: 3. Calculate Karl Pearson's coefficient of skewness : ) neaved bnabsiale Variable Frequency Variable…
A:
Q: You test a new drug to reduce blood pressure. A group of 15 patients with high blood pressure report…
A: Since you have posted a question with multiple sub-parts, we will solve first three sub-parts for…
Q: CMNO4 1.00 ppm 2.50 ppm 5.00 ppm 7.50 ppm 10.00 ppm 15.00 ppm 20.00 ppm 25.00 ppm unknown Absorbance…
A: Solution: Let X be the CMnO4- and Y be the absorbance at 580 nm. From the given information,
Q: Of var Toi ts. ir 21:5. If the average fraction defective of a large sample of a product is 0-1537,…
A:
Q: 12) A partner has finished an experiment and submitted the following result for an analysis of…
A: Confidence interval
Q: You are conducting quality control for a company that manufactures LED displays. The factory you are…
A: We are given a random sample of 1500 LED displays from this factory. We want to evaluate how many of…
Q: 4. Rapid hamster growing population has been posing an issue to Hamsterville. It just takes a few…
A: (a) i) From the given information, the required details are tabulated below, Year (t) Population…
Q: 8. What is the value of the P-value AP-value <0.001 BP-value = 0.0238 CP-value - 0.025 DP-value -…
A: By solving the above question, we found z statistic = 1.98
Q: Daniel Bernoulli's work in 1760 had the goal of appraising the effectiveness of a controversial…
A: Given: n(t)=number of individuals surviving t years later x(t)= number of members of cohort who have…
Q: Two different analytical methods were used to determine residual chlorine in sewage nethods were…
A: Given information: The data represents the concentration of CI in mg/L for a sample of 8…
Q: ou test a new drug to reduce blood pressure. A group of 15 patients with high blood pressure report…
A: Note: Since the answers for part (a) and part(b) is not given. We need to find the confidence…
I need Question 1 Solution


Trending now
This is a popular solution!

Step by step
Solved in 2 steps


- A survey across generations of workers gathered data on engagement at work. The results for a sample of 1,000 workers are in the accompanying contingency table. At the 0.10level of significance, is there evidence of a significant relationship between generation and level of engagement in the workplace? Contingency Table GENERATION LEVEL OF ENGAGEMENT Millennials Gen Xers Baby Boomers Traditionalists Total Engaged 96 110 94 12 312 Not Engaged 199 176 130 10 515 Actively Disengaged 53 59 54 7 173 Total Question content area bottom Part 1 What are the null and alternative hypotheses to test? H0: No relationship exists between generation and level of engagement. H1: A relationship exists between generation and level of engagement. Part 2…Aircraft primer paints are applied to aluminum surfaces to improve paint adhesion. Theprocess engineering group responsible for this operation is interested in learning whetherthree different primers differ in their adhesion properties. An experiment was designed andconducted to investigate the effect of paint primer type on paint adhesion. For each primertype, six specimens were painted, then a finish paint was applied, and the adhesion force wasmeasured. The data from the experiment are shown in the following table.Adhesion force (MPa)Primer Type X 4.5 4.5 4 5 5.5 5Y 5.5 5.5 6 6.5 7 7Z 3.5 4 3 4 5 4.5a) What type of experiment is this? What type of analysis id needed for the investigation?Break down the details and parameters of this experiment design. You must list theparameters that were considered in the design and also mention the quantity of each.b) Does primer type make a significant impact on adhesion, at 5% significance level?In their study of the effectiveness of cardiac catheterization, McClellan,McNeil, and Newhouse (1994) used as an instrument the difference indistance to cardiac catheterization and regular hospitals. How could youdetermine whether this instrument is relevant? How could you determinewhether this instrument is exogenous?
- A paper in the Journal of Nervous and Mental Disorders reported the following data on the amount of dextroamphetamine excreted by a sample of children having organically related disorders and a sample of children with nonorganic disorders (dextroamphetamine is a drug commonly used to treat hyperkinetic children). Organic: 17.53, 20.60, 17.62, 28.93, 27.10 Nonorganic: 15.59, 14.76, 13.32, 12.45, 12.79 (Observations refer to percentage of recovery of the drug seven hours after its administration.) If we assume that the variances of the two groups of children are unequal, determine whether the true average percentages of recovery for the two conditions are equal at significance level 0.01A study of fox rabies in southern Germany gave the following information about different regions and the occurrence of rabies in each region. A random sample of n1 = 16 locations in region 1 gave the following information about the number of cases of fox rabies near that location. x1: Region I Data 3 7 8 7 5 8 8 1 3 3 3 2 5 1 4 6 A second random sample of n2 = 15 locations in region II gave the following information about the number of cases of fox rabies near that location. x2: Region II Data 4 2 4 1 3 8 5 4 4 4 2 2 5 6 9 Note: If a two-sample t-test is appropriate, for degrees of freedom d.f. not in the Student's t table, use the closest d.f. that is smaller. In some situations, this choice of d.f. may increase the P-value by a small amount and therefore produce a slightly more "conservative" answer.Use a calculator with sample mean and sample standard deviation keys to find x1 and s1 in region I, and x2 and s2 in region II. (Round your answers to two…New research suggests that the occurrence of celiac disease in a subject depends on the subject’s gender and whether the subject already has another autoimmune disorder (such as Hashimoto disease and/or Type I Diabetes). Researchers collected information from 860 patients complaining of gastrointestinal discomfort. data celiac; input gender $ hashimoto $ t1diabetes $ positive total; cards; female yes yes 27 124 female yes no 21 133 female no yes 22 117 female no no 16 109 male yes yes 14 95 male yes no 14 87 male no yes 9 97 male no no 11 99 ; run; title "Logistic model with gender"; proc logistic data=celiac; class gender (ref='male') / param=ref; model positive/total = gender; run; title "Logistic model with gender adjusted for presence of autoimune (t1diabetes and hashimoto) diseases"; proc logistic data=celiac; class gender (ref='male') / param=ref; class hashimoto (ref='no') / param=ref; class t1diabetes (ref='no') / param=ref; model positive/total = gender hashimoto…
- Colonoscopy is a medical procedure that is designed to find and remove precancerous lesions in the colon before they become cancerous. The article “Association of Colonoscopy and Death from Colorectal Cancer” (N. Baxter, M. Goldwasser, et al., Annals of Internal Medicine, 2009:1–8) reports that in a sample of 10,292 people diagnosed with colorectal cancer, 7.0% had previously had a colonoscopy, and in a sample of 51,460 people without colorectal cancer, 9.8% had previously had a colonoscopy. Can you conclude that the percentage of people who have had colonoscopies is greater in those without colorectal cancer?A study of fox rabies in a country gave the following information about different regions and the occurrence of rabies in each region. A random sample of n1 = 16 locations in region I gave the following information about the number of cases of fox rabies near that location. x1: Region I Data 2 8 8 8 6 8 8 1 3 3 3 2 5 1 4 6 A second random sample of n2 = 15 locations in region II gave the following information about the number of cases of fox rabies near that location. x2: Region II Data 1 1 5 1 4 8 5 4 4 4 2 2 5 6 9 (i) Use a calculator with sample mean and sample standard deviation keys to calculate x1 and s1 in region I, and x2 and s2 in region II. (Round your answers to two decimal places.) x1 = s1 = x2 = s2 = (ii) Does this information indicate that there is a difference (either way) in the mean number of cases of fox rabies between the two regions? Use a 5% level of significance. (Assume the distribution of rabies cases in both regions is…A study of fox rabies in southern Germany gave the following information about different regions and the occurrence of rabies in each region. A random sample of n1 = 16 locations in region 1 gave the following information about the number of cases of fox rabies near that location. x1: Region I Data 1 7 7 6 5 8 8 1 3 3 3 2 5 1 4 6 A second random sample of n2 = 15 locations in region II gave the following information about the number of cases of fox rabies near that location. x2: Region II Data 3 2 1 4 2 8 5 4 4 4 2 2 5 6 9 Note: If a two-sample t-test is appropriate, for degrees of freedom d.f. not in the Student's t table, use the closest d.f. that is smaller. In some situations, this choice of d.f. may increase the P-value by a small amount and therefore produce a slightly more "conservative" answer.Use a calculator with sample mean and sample standard deviation keys to find x1 and s1 in region I, and x2 and s2 in region II. (Round your answers to two decimal…
- A study of fox rabies in southern Germany gave the following information about different regions and the occurrence of rabies in each region. A random sample of n1 = 16 locations in region 1 gave the following information about the number of cases of fox rabies near that location. x1: Region I Data 1 7 7 6 5 8 8 1 3 3 3 2 5 1 4 6 A second random sample of n2 = 15 locations in region II gave the following information about the number of cases of fox rabies near that location. x2: Region II Data 3 2 1 4 2 8 5 4 4 4 2 2 5 6 9 Note: If a two-sample t-test is appropriate, for degrees of freedom d.f. not in the Student's t table, use the closest d.f. that is smaller. In some situations, this choice of d.f. may increase the P-value by a small amount and therefore produce a slightly more "conservative" answer.Use a calculator with sample mean and sample standard deviation keys to find x1 and s1 in region I, and x2 and s2 in region II. (Round your answers to two decimal…A study of fox rabies in southern Germany gave the following information about different regions and the occurrence of rabies in each region. A random sample of n1 = 16 locations in region 1 gave the following information about the number of cases of fox rabies near that location. x1: Region I Data 2 7 7 7 7 8 8 1 3 3 3 2 5 1 4 6 A second random sample of n2 = 15 locations in region II gave the following information about the number of cases of fox rabies near that location. x2: Region II Data 1 3 4 3 3 8 5 4 4 4 2 2 5 6 9 (a) Does this information indicate that there is a difference (either way) in the mean number of cases of fox rabies between the two regions? Use a 5% level of significance. (Assume the distribution of rabies cases in both regions is mound-shaped and approximately normal.) (i) What is the level of significance?State the null and alternate hypotheses. H0: μ1 ≠ μ2; H1: μ1 = μ2H0: μ1 = μ2; H1: μ1 ≠ μ2 H0: μ1 > μ2; H1: μ1 = μ2 H0: μ1 = μ2;…A study of fox rabies in southern Germany gave the following information about different regions and the occurrence of rabies in each region. A random sample of n1 = 16 locations in region 1 gave the following information about the number of cases of fox rabies near that location. x1: Region I Data 2 7 7 7 7 8 8 1 3 3 3 2 5 1 4 6 A second random sample of n2 = 15 locations in region II gave the following information about the number of cases of fox rabies near that location. x2: Region II Data 1 3 4 3 3 8 5 4 4 4 2 2 5 6 9 (b) Find a 95% confidence interval for μ1 − μ2. (Round your answers to two decimal places.) lower limit upper limit